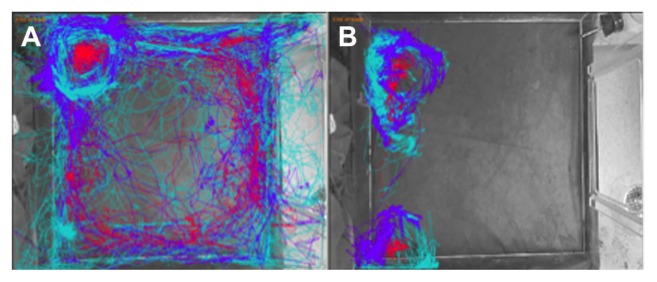
Figure 2.

Automated Open Field Analysis Track Plots. Animals were placed in an open field and allowed to explore and move around in the cage. Animal behavior and movement patterns were recorded and analyzed using Ethovision XT software. The software tracked the nose (turquoise), center-point (red) and tail base (purple) of each animal. Visual representation of locomotor activity of a representative pre-stroke (A) and representative post-stroke (B) animal are shown.
