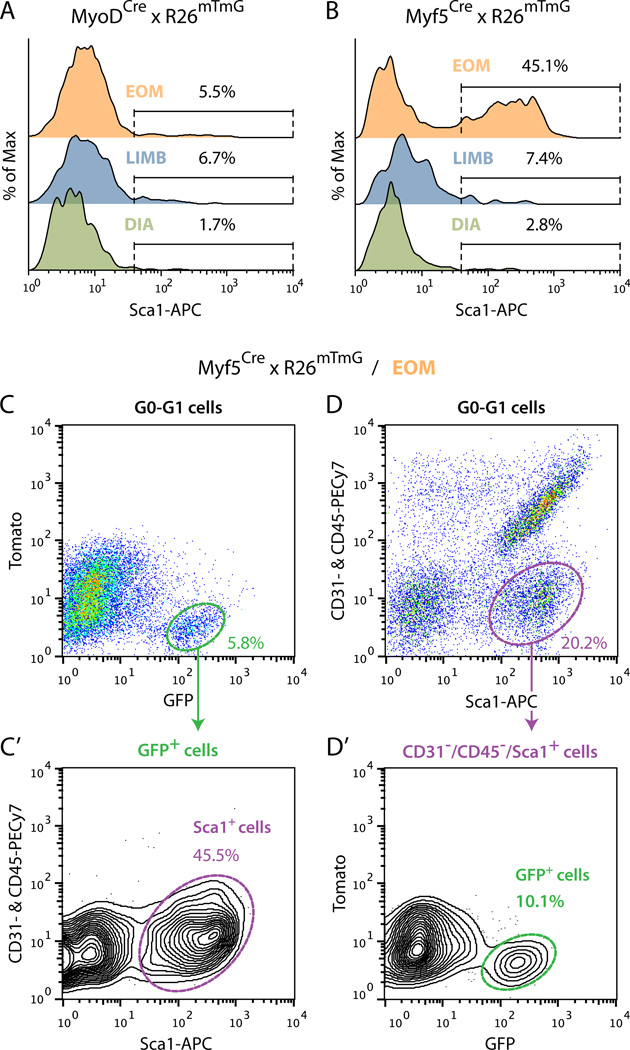
Fig. 2. Flow cytometric profiles of Cre-driven GFP+ cells isolated from muscle tissues of (A) MyoDCre and (B–D’) Myf5Cre reporter lines.
(A) and (B) Representative FACS overlay histograms analyzing Sca1 staining (X-axis) within GFP+ cells isolated from EOM, LIMB (hindlimb muscles: tibialis anterior, extensor digitorum longus and gastrocnemius) and DIA (diaphragm) of (A) MyoDCre × R26mTmG and (B) Myf5Cre × R26mTmG mice. All populations were analyzed from G0-G1 cells after depletion of CD31+ and CD45+ cells. In each histogram the distribution of GFP+ cells (Y-axis) is depicted in a normalized fashion as %of Max based on the number of cells in each bin divided by the number of cells in the bin that contains the largest number of cells. (C–D’) Detailed flow cytometric characterization of Myf5Cre-driven GFP+ cells isolated from EOM. (C) and (C’) Representative FACS plots showing (C) GFP staining among all G0-G1 cells and subsequent gating of GFP+ cells, and (C’) the distribution of the GFP+ population according to staining for CD31 and CD45 (Y-axis) versus Sca1 (X-axis). (D, D’) Representative FACS plots showing (D) the distribution of G0-G1 cells according to staining for CD31 and CD45 (Y-axis) versus Sca1 (X-axis) and subsequent gating of CD31−/CD45−/Sca1+ cells and (D’) the distribution of the CD31−/CD45−/Sca1+ cells according to GFP staining. In all plots, %values indicate the frequency of the highlighted population out of the total parent population analyzed as indicated at the top of each panel. Histograms and plots are all from one representative experiment of at least 3 independent experiments, which showed no significant differences.

