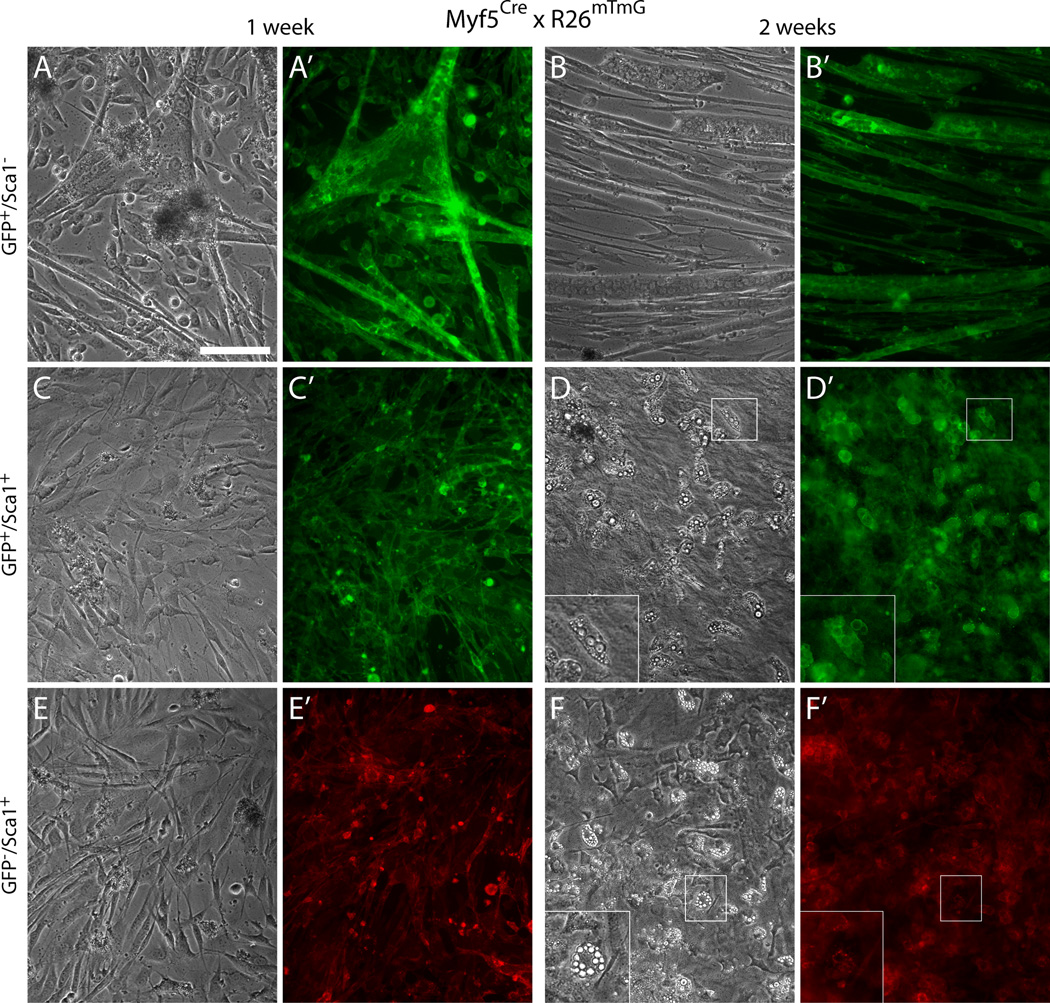
Fig. 3. Sca1±/GFP+ cells isolated from EOM preparations of the Myf5Cre reporter line distinctively give rise to myogenic and non-myogenic progeny, respectively.
Representative images of day 7 and day 14 cultures of (A–B’) GFP+/Sca1− cells, (C–D’) GFP+/Sca1+ cells, and (E–F’) GFP−/Sca1+ cells, isolated by FACS as shown in Fig. 2C–D’. All populations were sorted from G0-G1 cells after depletion of CD31+ and CD45+ cells. Inserts in the lower left corner of (D) and (F) represent higher magnification views of the regions delineated by a white box in each corresponding panel, depicting adipogenic cells that develop spontaneously in the cultures of the non-myogenic cells with time. Scale bar, 100µm.

