
Figure 5. Hypoxia-“de-differentiated” cells are pluripotent.
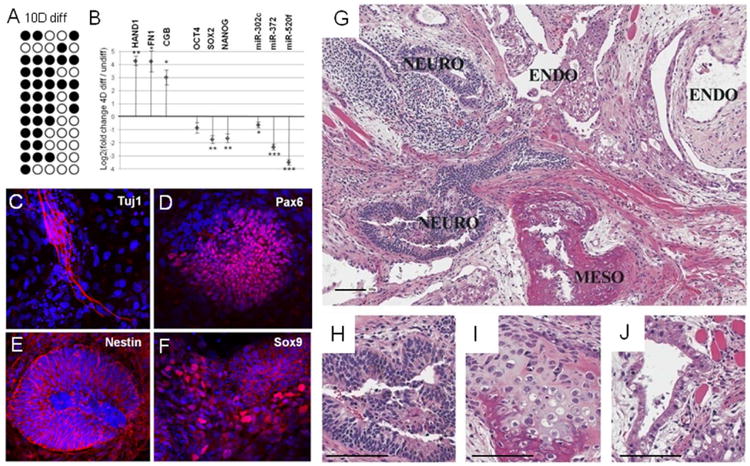
(A) Methylation analysis of OCT4 promoter region in H1 de-differentiated cells differentiated for 10 days with serum. White circles represent unmethylated; black circles methylated cytosine-phosphate-guanosine (CpG). (B) qPCR analysis of differentiation markers (HAND1, FN1 and CGB) and stem cell markers (OCT4, SOX2, NANOG, miR-302c, miR-372 and miR-520f) in 4-day differentiated Oct4-GFP “de-differentiated” cells compared to Oct4-GFP “de-differentiated” cells. Error bars show SEM for 4 separate experiments. *, P< 0.05; **, P< 0.01 and ***, P<0.001. (C-F) Representative pictures of immunostaining of retinal progenitor markers PAX6, TUJ1, NESTIN and SOX9 in H1 “de-differentiated” cells after 3 weeks of retinal induction. (G-J) Hematoxylin and eosin stained sections of teratoma obtained after injection of H1 “de-differentiated” cells in immunodeficient mice. Differentiated tissues from all 3 germ layers are apparent. Survey view (10×) a well-differentiated teratoma is shown in G. Ectoderm-derived included neural tissue with rosette formation and occasional pigmented neuroectodermal regions (Neuro); mesoderm-derived included bone and cartilage (Meso); Endoderm-derived structures included dilated ducts or glands lined by ciliated to attenuated cuboidal epithelium (Endo). Higher magnification (20×) of differentiated tissues: pigmented neuroectoderm (H); cartilage and bone (I); gland lined by ciliated epithelium (J). Bars represent 100μm.