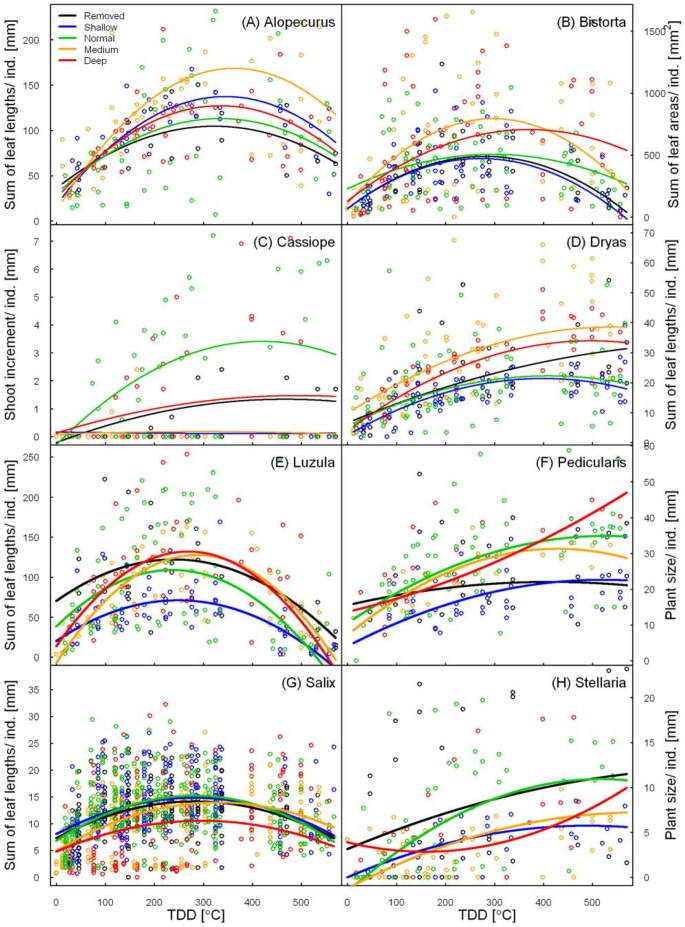
Figure 1. Relationship between TDD (cumulative sum of thawing degree days, i.e. positive air temperature sums) and plant sizes.
a) the average sum of leaf lengths of all Alopecurus magellanicus individuals; b) the average sum of leaf areas of all Bistorta vivipara individuals; c) the average annual shoot increment of all Cassiope tetragona individuals; d) the average sum of leaf lengths of all Dryas octopetala individuals; e) the average sum of leaf lengths of all Luzula arcuata individuals; f) the average plant size of all Pedicularis hirsuta individuals; g) the average sum of leaf lengths of all Salix polaris individuals; h) the average plant size of all Stellaria crassipes individuals. Coefficients are derived from a quadratic linear mixed-effect model, separated by treatments. Normal = unmanipulated snow cover; Removed = snow removal on 1. May; Shallow = naturally early snowmelt; Medium = intermediately increased snow; Deep = maximally increased snow. Outliers are not shown for better visualization. Note: The green (living) plant size decreases at end of season (highest TDD) due to senescence and leaf-drop.

