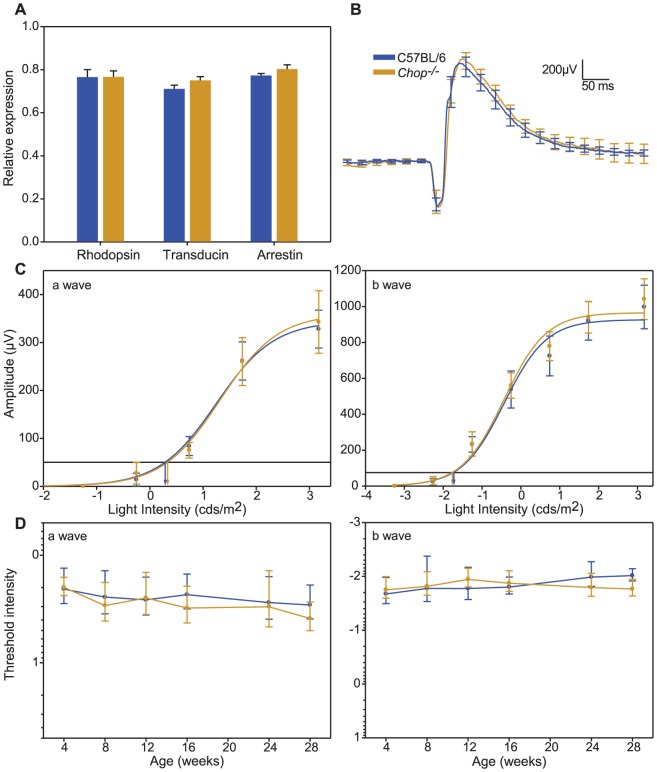
Figure 1. Effect of Chop on the expression of phototransduction genes and visual function.
(A). Quantitative RT-PCR analysis of 4 week old C57BL/6 and Chop−/− mice (n = 4). Samples were normalized to β-actin levels. (B). Average scotopic ERG a- and b-wave waveforms from 4 week old C57BL/6 (blue trace) and Chop−/− (orange trace) mice in response to 1 ms flashes (n = 7–9). (C) Intensity-response functions of a- and b-waves recorded from the same C57BL/6 and Chop−/− mice. Horizontal lines and vertical intercepts on the abscissa (a-wave It: 50 µV, b-wave It: 75 µV) show the method used to determine threshold light intensities (It). (D) Age related changes in a- and b-wave threshold light intensities in C57BL/6 and Chop−/− mice. Error bars are ± SD.

