
Figure 6. ERG changes as a function of age in GHL+ and GHL+/Chop−/− mice.
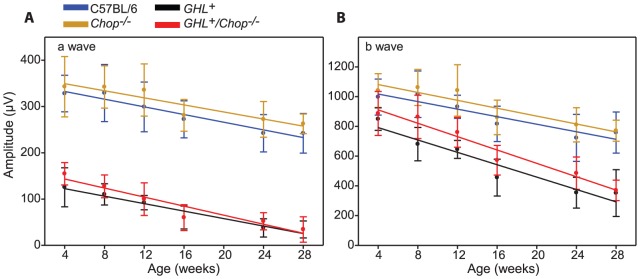
Maximal a- and b-wave amplitudes as a function of age in C57BL/6 (blue trace), Chop−/− (orange trace) GHL+ (black trace) and GHL+/Chop−/− (red trace) mice. Colored lines are polynomial fits.