
Figure 9. Rate of retinal degeneration in GHL+ and GHL+/Ask1−/− mice.
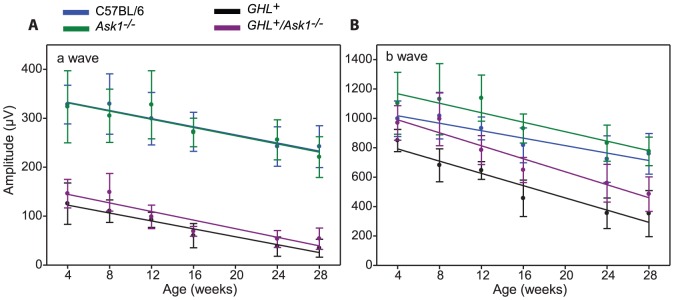
Maximal a- and b-wave amplitudes as a function of age in C57BL/6 (blue), Ask1−/− (green) GHL+ (black) and GHL+/Ask1−/− (purple) mice. Error bars: ± SD. Colored lines are polynomial fits.