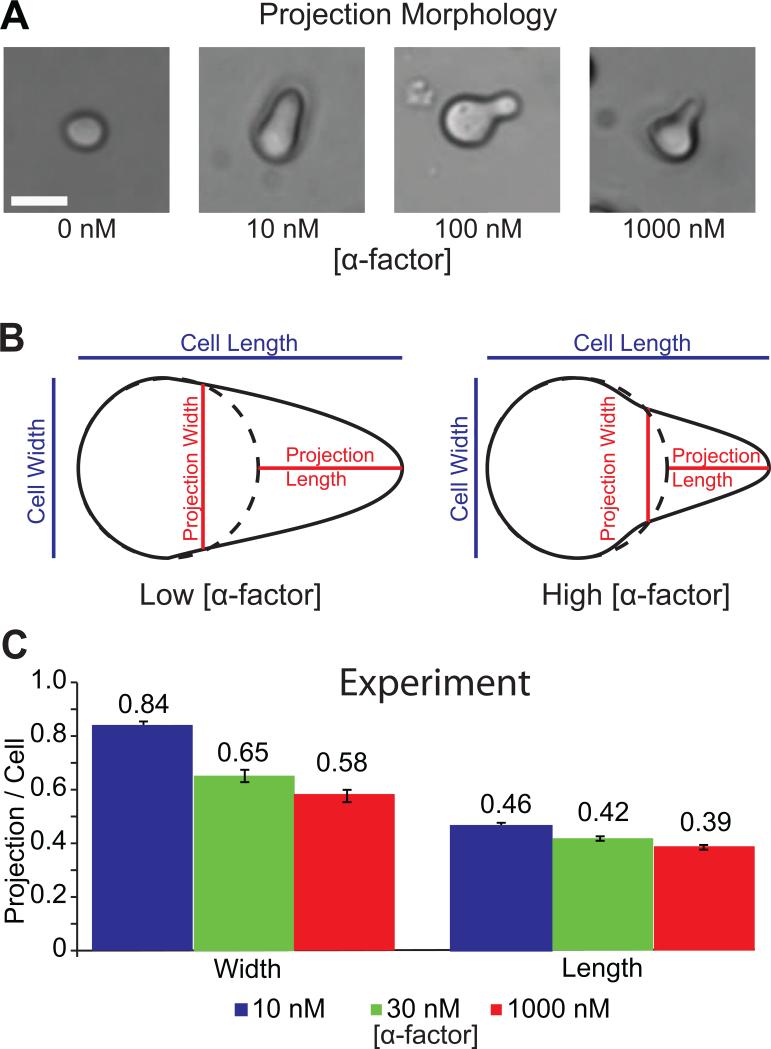
Figure 2.
Yeast projection width and length are inversely related to pheromone concentration. (A) Yeast cells after 3 hours exposure of α-factor (0, 3, 10, 30, 100 and 1000 nM) form morphologically distinct mating projections (scale bar = 5μm) (B) Schematic of projection length and width quantification. Projection length and width are determined by comparing cell images before and after exposure to a pheromone gradient. (C) Statistics of projection length and width normalized by pre-stimulation cell diameter are compared after exposure to high and low concentrations of α-factor (10 nM, blue bars, n=24; 30 nM, green bars, n=24; 1000 nM, red bars, n=24; there was a significant difference between the 10 nM and 1000 nM data by t-test, p < 0.001).

