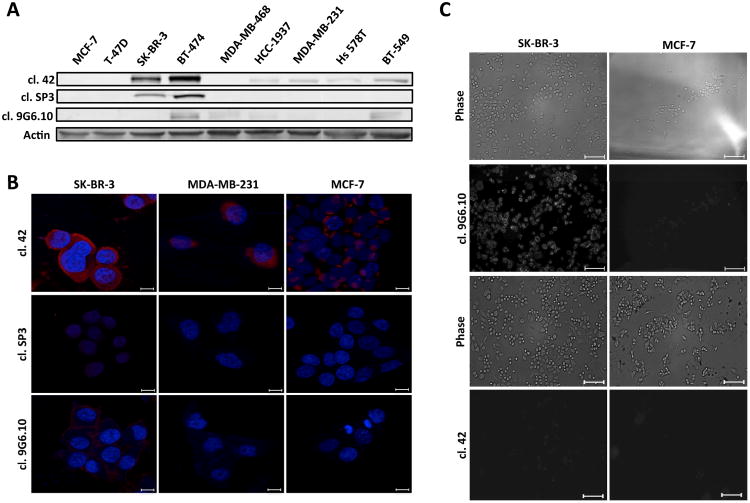
Figure 1.
Anti HER-2 antibodies tested by immunoblot (A) and immunofluorescence (B) or live cell microscopy (C) analyses. A. Breast cancer cell lines representative of the five different breast cancer molecular subtypes were used (MCF-7, T-47D and BT-474, Luminal like; SK-BR-3, HER2 overexpressing; MDA-MB-468 and HCC 1937, Basal like; MDA-MB-231, Hs 578T and BT-549, Normal like). Fifty μg of total cell lysate was loaded per lane. Actin was used as a loading control. B. Three breast cancer cell lines with different HER2 expression levels based on immunoblot (SK-BR-3 high; MDA-MB-231, intermediate; MCF-7, low) were subjected to indirect immunofluorescence followed by confocal microscopy. HER2 primary antibodies as indicated, secondary antibodies Alexa 568, DNA, DAPI. Scale bar: 20 µm. C. Anti-HER2 antibodies tested by live cell immunofluorescence microscopy. SK-BR-3 and MCF-7 breast cancer cell lines were used as positive and negative control for HER2 protein expression. Cells were plated on Lab-Tek dishes and incubated with the indicated anti-HER2 antibody for 1 h followed by 30 min incubation with secondary Alexa 488 antibody. Live cells were imaged by phase contrast (top panels) or fluorescence (bottom panels). Scale bar 10 μm.

