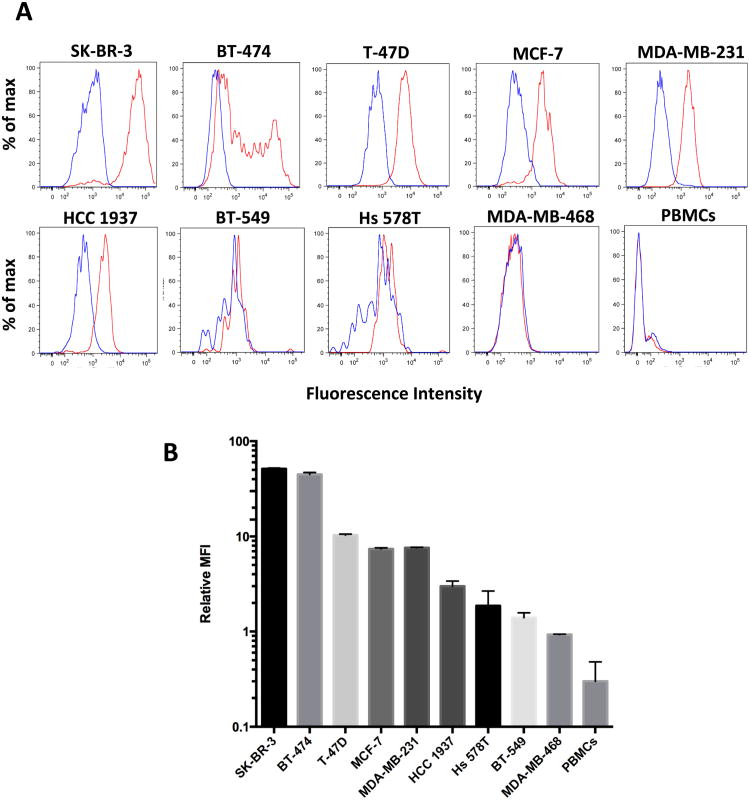
Figure 2.
A. HER2 protein expression levels in breast cancer cell lines and healthy donor PBMCs tested by flow cytometry using the anti-HER2 antibody clone 9G6.10 (red lines) or IgG control (blue lines). Live cells were incubated with anti-HER2 antibody or matching IgG followed by secondary Alexa 488. Ten thousand events were acquired for each condition. X-axis shows logarithmic fluorescence intensity; Y-axis shows percent of max. B. Relative Mean Fluorescence Intensity (MFI) of HER2 protein assayed by flow cytometry; HER2 MFI was normalized using the IgG control MFI in each cell line. (SEM shown as error bar).

