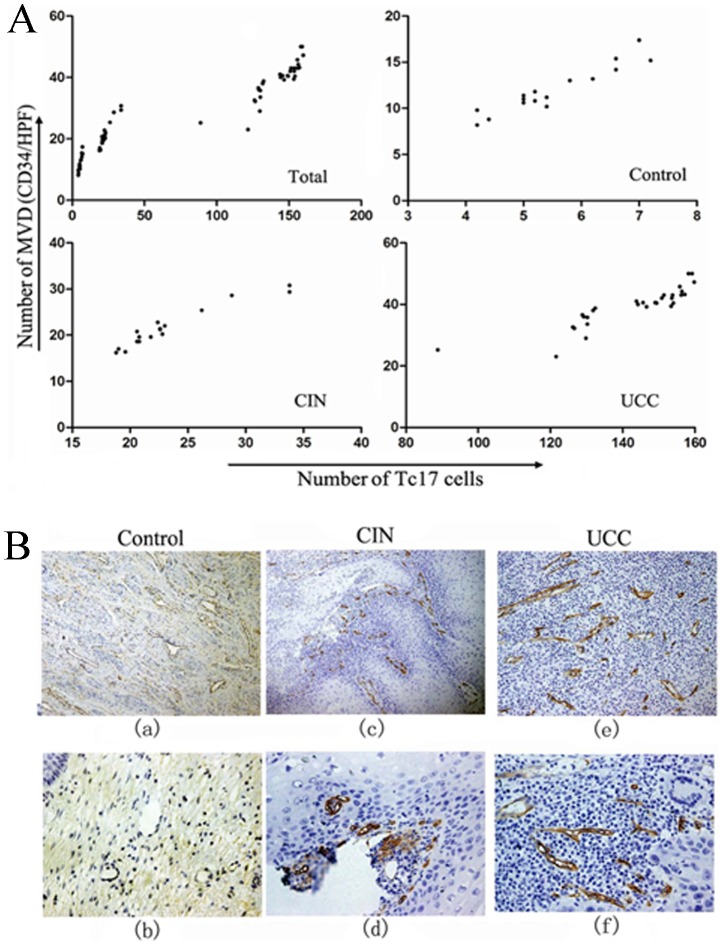
Figure 5. The correlations between Tc17 cells and microvessel density (MVD).
(A) Linear regression analysis between the levels of Tc17 cells and MVD (Total: r = 0.987, P<0.0001, n = 65; control: r = 0.814, P<0.001, n = 18, CIN: r = 0.923, P<0.001, n = 17; UCC: r = 0.938, P<0.0001, n = 30). MVD from each sample was plotted against Tc17 cells level from the same person. (B) Representative immunohistochemical staining of MVD in cervical tissues of three groups. Representative sites with low (100×, upper panels) and high (400×, lower panels) magnification were shown.

