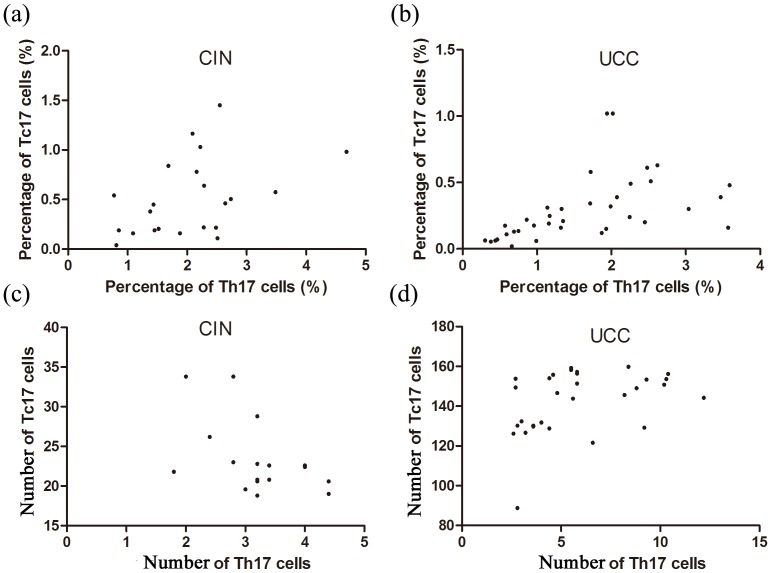
Figure 6. The correlations between Tc17 cells and Th17 cells.
(a, b) Linear regression analysis between frequencies of Tc17 cell and Th17 cells in the blood (rCIN = 0.435, P = 0.042, n = 22; rUCC = 0.403, P = 0.016, n = 36). (c, d) Linear regression analysis between the levels of Tc17 cells and Th17 cells in the cervical tissues (rCIN = 0.441, P = 0.039, n = 17; rUCC = 0.693, P = 0.026, n = 30).

