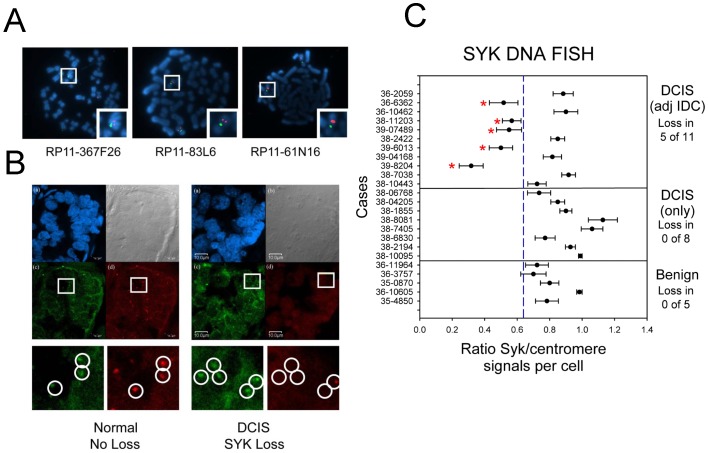
Figure 1. DNA FISH Analysis.
A. Normal control metaphase spreads were used to validate the SYK probe (chromosome 9). The centromeric probe for chromosome 9 is green and the probe for SYK is red. Each BAC was labeled with Spectrum Orange™ (a) RP11-367F26, (b) RP11-83L6, (c) RP11-61N16. B. Confocal microscopy imaging of FISH slides. The panel at left is an example of normal mammary tissue and the panel at right is of DCIS tissue with SYK gene loss. In both, (a) DAPI-stained nuclei, (b) differential interference contrast imaging of section, (c) SYK FISH signal (green), (d) chromosome 9 centromere signal (red). C. The mean value for the ratio of SYK/chromosome 9 centromere signals for each case is illustrated in a bar plot for benign only, DCIS only, and DCIS with adjacent IDC samples. The mean was determined for each case from the ratios obtained individually from 30 cells. Error bars indicate S.E. of the mean. The mean SYK/control ratio of the combined cases was 0.92+/−0.048 S.E. for DCIS only tissues and 0.70+/−0.057 S.E. for DCIS adjacent to IDC cases. The mean for benign only tissues was 0.80+/−0.050 S.E.. The ANOVA P value for the three tissues was 0.035.

