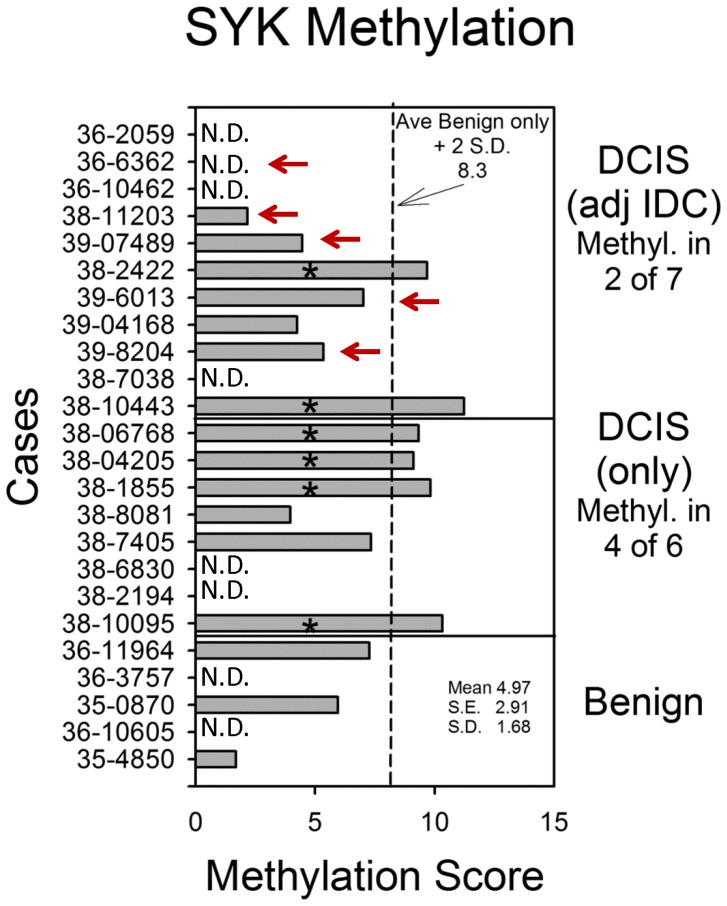
Figure 2. SYK promoter methylation.
The mean value for promoter methylation at 4 CpG islands was plotted for each case. DCIS cases are arranged by whether adjacent IDC was absent or present, and benign only cases are shown for comparison (mean 4.97+/−1.68 S.D., 2.91 S.E.). The dashed line indicates the mean of the benign cases plus 2 S.D. (8.3). Red arrows indicate cases where FISH identified allelic loss.

