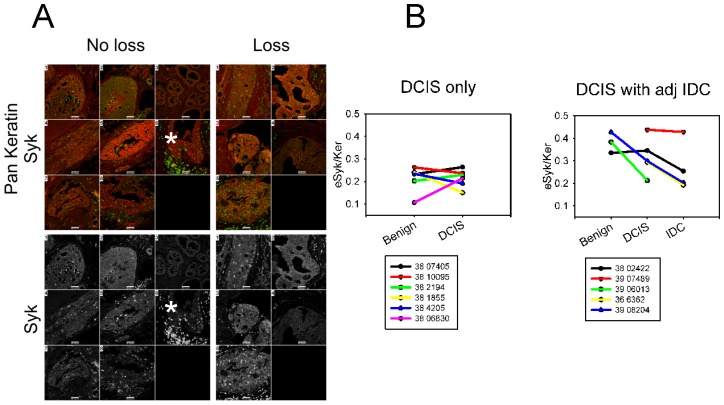
Figure 3. Immunofluorescence staining of DCIS tissues.
A. Immunofluorescence confocal images of ductal carcinoma in situ (DCIS) tissues from 8 cases with no allelic loss determined by DNA FISH (unless otherwise indicated, DCIS with adjacent IDC): 1) 38 002422 (methylated), 2) 38 06830 (DCIS only, methylation status unknown), 3) 38 10095 (DCIS only, methylated), 4) 38 2194 3 (DCIS only, methylation status unknown), 5) 38 4205 (DCIS only, methylated), 6) 38 7405 A5 (DCIS only, not methylated), 7) 38 8081 8 (DCIS only, not methylated), 8) 39 04168 (not methylated) and 5 cases of DCIS with allelic loss determined by DNA FISH (all DCIS with adjacent IDC: 1) 38 6362, methylation status unknown, 2) 38 11203 (not methylated) 5, 3) 39 06013 (not methylated), 4) 39 07489 (not methylated), 5) 39 08204 (not methylated). Note that anti-Syk staining highlights the presence of a subpopulation of lymphocytes and/or other infiltrating inflammatory cells that is always more intense than tumor epithelium staining (see asterisks). Myoepithelial cells are negative. There was no obvious difference between the intensity of either anti-Syk or anti-pan keratin staining between sections of tissue with or without allelic loss. Scale bars = 50 µm. B. The ratios of eSyk/Ker from individual cases were segregated according to DCIS only versus DCIS with adjacent IDC. DCIS only cases are shown on the left (DCIS) and DCIS with adjacent IDC are shown on the right (DCIS with adj IDC). Data was plotted using eSyk/Ker ratios. All available tissues from each case section were used but were not available for every case. Only cases with two or more tissues present were plotted.

