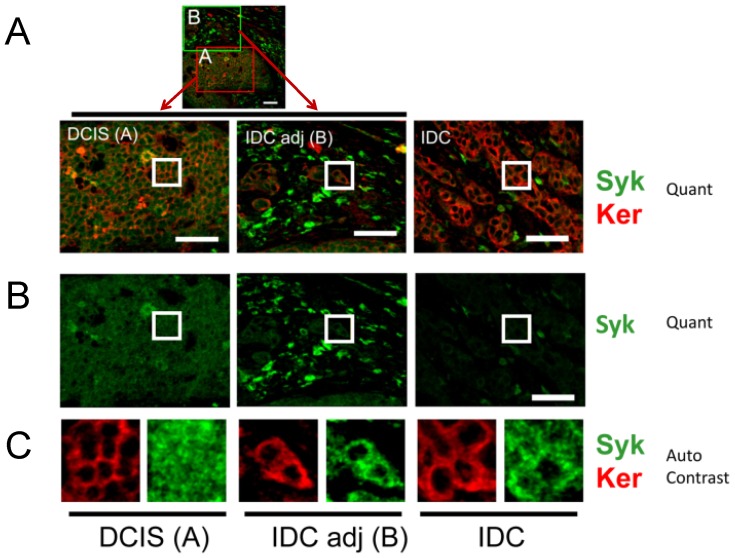
Figure 4. Representative confocal immunofluorescence staining of Syk and keratin in a single case, 36 6362.
Two-color images of Syk and keratin staining (Syk,/Ker Quant) are shown for DCIS and IDC tissues within the same confocal image (low magnification view of DCIS with adjacent IDC: “DCIS (A)” and “IDC adj (B)”). IDC from the same slide but a different field of view is shown (“IDC”). The single color, Syk only staining is shown below (Syk, Quant). The background subtracted images were acquired and presented quantitatively for direct comparison (Quant). To qualitatively compare the localization of Syk and keratin, insets are shown on the bottom panels where brightness and contrast were optimized using the auto-contrast function in Metamorph Offline software (Auto Contrast). Keratin is always cytoplasmic, whereas Syk can also be nuclear. The asterisk highlights an area of immune cell infiltration. Scale bars = 50 µm.

