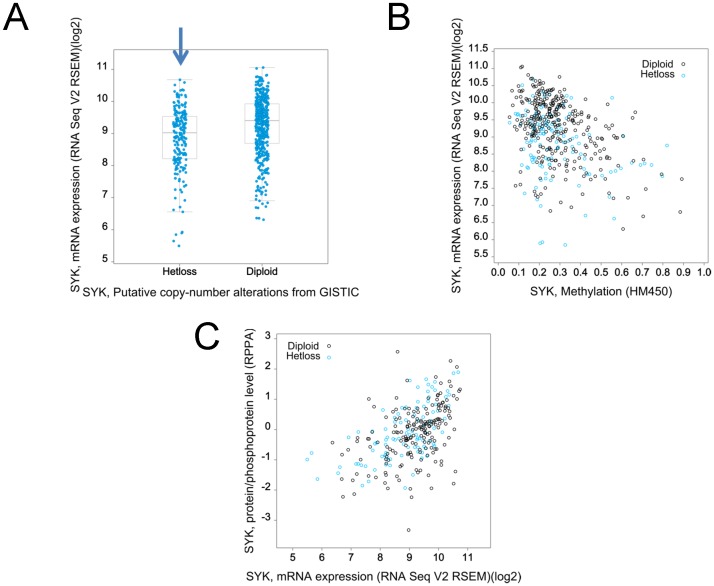
Figure 5. Characterization of the relationship between SYK copy number, mRNA, and protein in immune depleted cases from TCGA Provisional Study.
801 of 1002 breast cancer cases were characterized as immune depleted (see methods) and were used for the following graphs. A. Putative SYK copy number (x-axis) for Diploid and Hetloss is plotted against SYK mRNA in a box plot. The blue arrow indicates the Hetloss group. B. SYK methylation (x-axis) is plotted against SYK mRNA (y-axis) for individual cases of HetLoss or Diploid. Blue circles indicate putative heterozygotic loss and black circles indicate diploid copy number. Dashed line indicates cutoff methylation level. C. SYK mRNA is plotted against Syk protein/phosphoprotein levels for Diploid and Hetloss cases.

