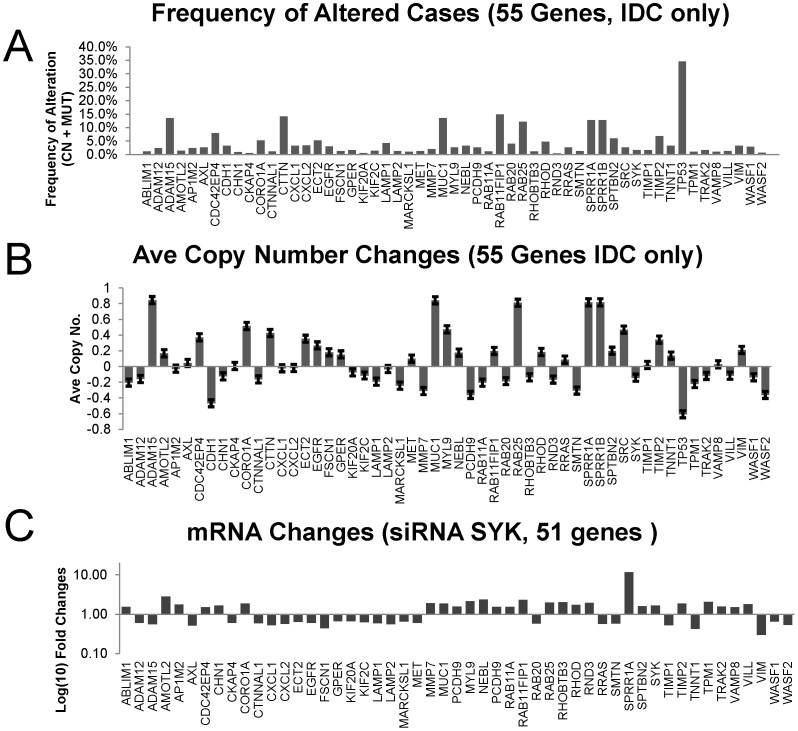
Figure 8. Comparisons of SYK-regulated mRNA changes, average copy numbers, and percent of cases altered.
A. The % altered IDC cases were plotted for each member of the 55 Gene Set. B. The average copy number was plotted for each member of the 55 Gene Set . C. Fold changes in mRNAs (log) of genes regulating motility and invasion following SYK siRNA knockdown in ER-negative, MCF10A breast cells [3] were plotted for 51 mRNA species.

