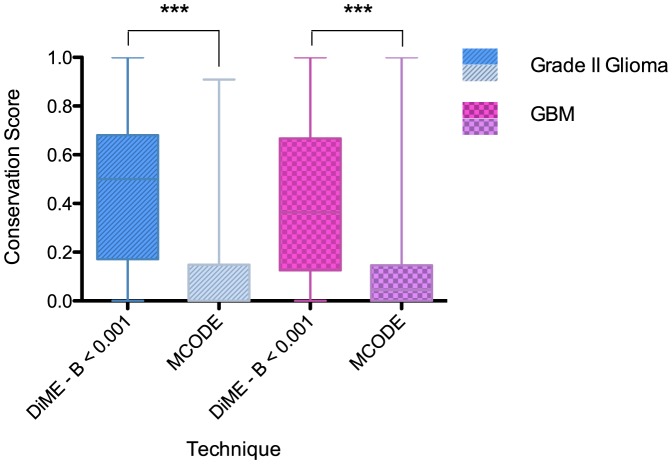
Figure 3. DiME is robust to edge noise in co-epxression networks.
Shown in the plots are results for the grade II glioma networks (left panel) and GBM networks (right panel). The horizontal axes display the technique used, and vertical axes show average conservation scores. Only modules with size larger than 5 are taken into consideration. Asterisks denote statistical significance in Student's  -tests when comparing means with MCODE modules: “***” -
  .
.

