
Figure 3. Peak velocity data.
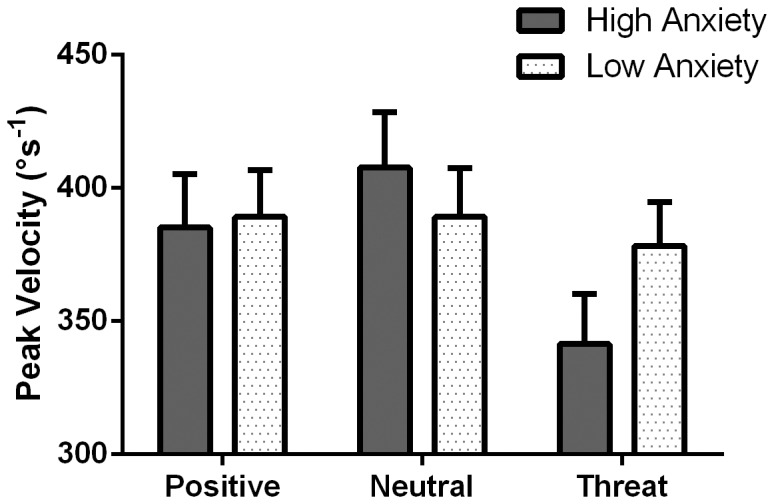
Mean peak velocities for erroneous antisaccades in response to positive, neutral and threat stimuli for high and low anxious participants. Error bars represent the standard error.
Official websites use .gov
A
.gov website belongs to an official
government organization in the United States.
Secure .gov websites use HTTPS
A lock (
) or https:// means you've safely
connected to the .gov website. Share sensitive
information only on official, secure websites.
Mean peak velocities for erroneous antisaccades in response to positive, neutral and threat stimuli for high and low anxious participants. Error bars represent the standard error.