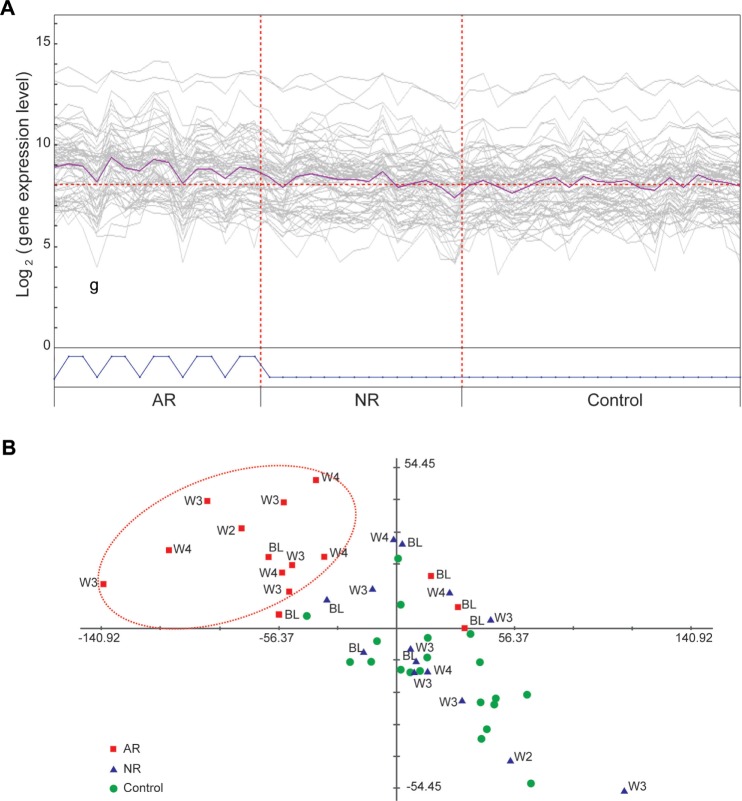
Figure 5.
Pattern matching of gene expression changes over time reveals a molecular signature associated with AR. A. PTM analysis showing genes matching the expression signature of upregulation from pretransplant to posttransplant in AR patients only. Five AR patients and 5 matched NR patients with the precisely matched time points were used for the analysis. The 3 time points used (plotted consecutively for each patient) are pretransplant (BL), 7 days prerejection (−7), and at rejection (RJ). B. PCA plot visualizing the expression signature described in A. The AR patients (red squares, with week [W] posttransplant data indicated) are moving away from their pretransplant time point (BL) as well as from control patients (green circles) and NR patients (blue triangles) as they are approaching rejection.

