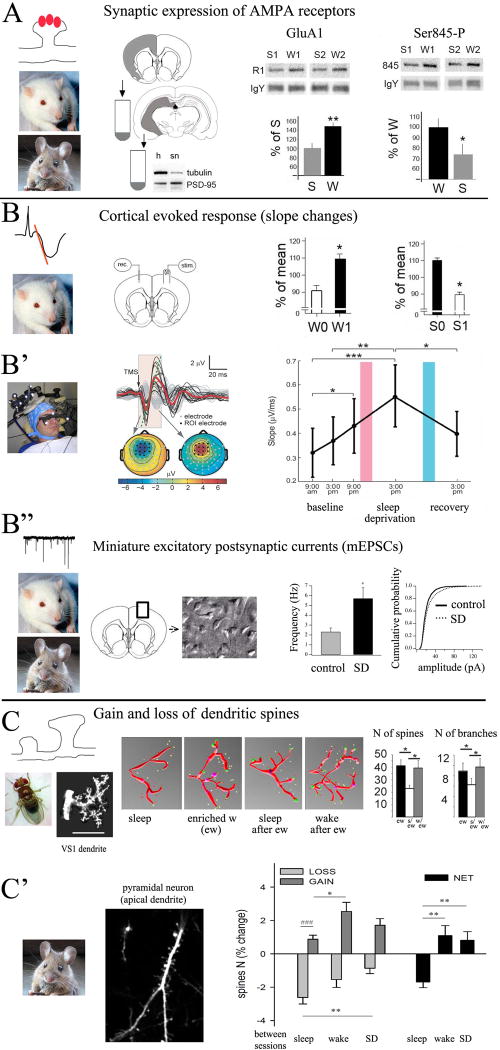
Figure 3. Evidence supporting SHY.
A, experiments in rats and mice show that the number and phosphorylation levels of GluA1-AMPARs increase after wake (data from rats (Vyazovskiy et al., 2008)). B, B′, electrophysiological analysis of cortical evoked responses using electrical stimulation (in rats; from (Vyazovskiy et al., 2008)) and TMS (in humans, from (Huber et al., 2012)) shows increased slope after wake and decreased slope after sleep. In B, W0 and W1 indicate onset and end of ∼ 4h of wake; S0 and S1 indicate onset and end of ∼ 4h of sleep, including at least 2h of NREM sleep. In B′, pink and blue bars indicate a night of sleep deprivation and a night of recovery sleep, respectively. B″, in vitro analysis of mEPSCs in rats and mice shows increased frequency and amplitude of mEPSCs after wake and sleep deprivation (SD) relative to sleep (control). Data from rats (Liu et al., 2010). C, in flies, the number of spines and dendritic branches in the visual neuron VS1 increase after enriched wake (ew) and decrease only if flies are allowed to sleep (from (Bushey et al., 2011). C′, structural studies in adolescent mice show a net increase in cortical spine density after wake and sleep deprivation (SD) and a net decrease after sleep (from (Maret et al., 2011).

