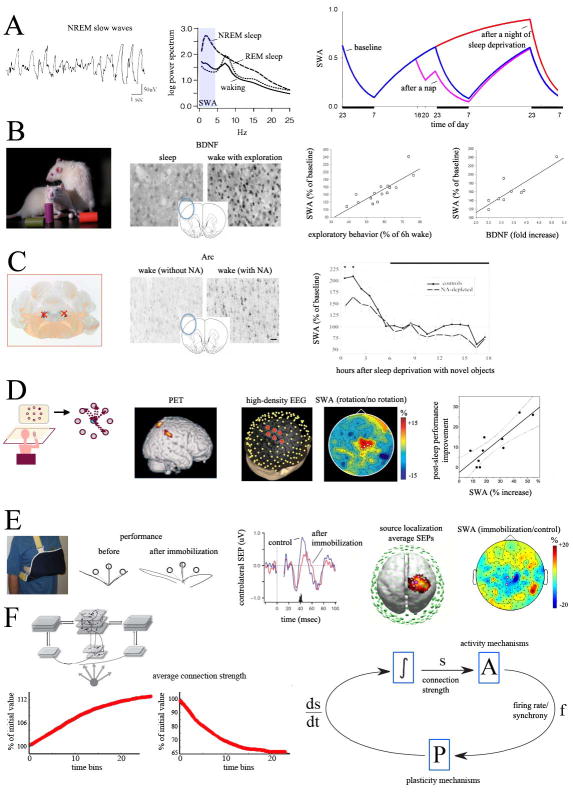
Figure 4. SHY and slow wave activity (SWA).
A, SWA, a quantitative measure of the number and amplitude of slow waves (left), is high in NREM sleep and low in REM sleep and wake (middle). SWA increases with time spent awake and decreases during sleep, thus reflecting sleep pressure (right). B, in rats kept awake for 6 hours by exposure to novel objects, longer times spent exploring result in greater cortical induction of BDNF during wake, as well as in larger subsequent increases in SWA at sleep onset (from (Huber et al., 2007b). C, after bilateral lesions of the LC expression of plasticity-related genes during wake is low; during subsequent sleep, SWA is lower than in non-lesioned controls (from (Cirelli et al., 1996; Cirelli and Tononi, 2000). D, during wake, subjects learn to adapt to systematic rotations imposed on the perceived cursor trajectory, a task which activates right parietal areas (Ghilardi et al., 2000); during subsequent NREM sleep, SWA in the same areas shows a local increase, which correlates with post-sleep improvements in performance (from (Huber et al., 2004)). E, after a subject's arm is immobilized during the day, motor performance in a reaching task deteriorates, and the P45 cortical component of the response evoked by stimulation of the median nerve (SEP) decreases in contralateral sensorimotor cortex. In sleep post-immobilization, the same area shows a local decrease in SWA (from (Huber et al., 2006). F, Control loop for the homeostatic regulation of connection strength and firing rate/synchrony, based on the results of computer simulations of slow wave sleep (Olcese et al., 2010). Here connection strength (s) affects firing rates and synchrony (f) via activity mechanisms (A). During slow wave sleep, plasticity mechanisms (P) lead to a depression of synaptic strength (ds/dt) that is proportional to f. The resulting integrated value of connection strength (∫), in turn, determines the new value of firing rates and synchrony (f). As an example, strong average connection strength will lead to high firing rates and synchrony which, in turn, will strongly depress synapses, to bring the system back to baseline values of connection strength. Conversely, when connections are renormalized, activity levels will not be able to induce significant plastic changes and the system will reach a self-limiting equilibrium point.

