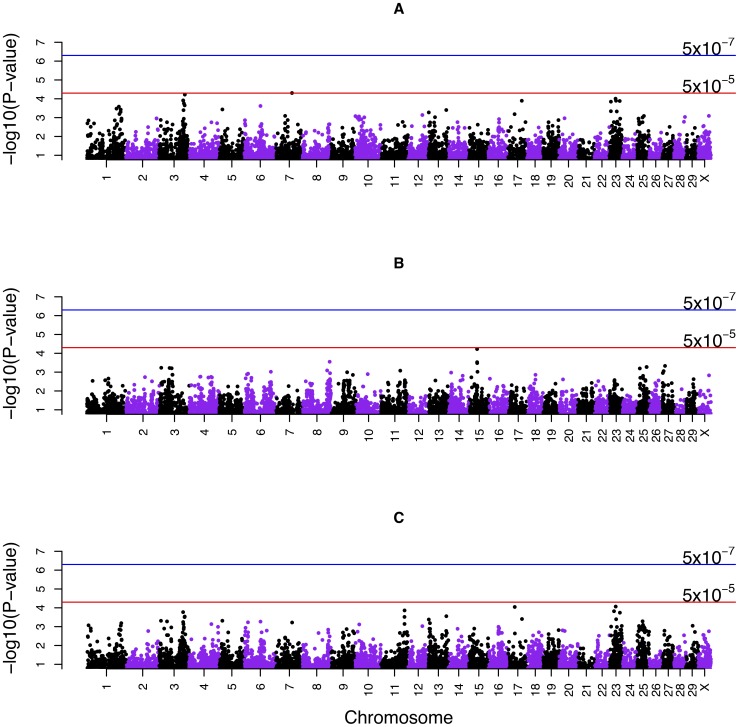
Figure 1. Manhattan plots displaying the results of single-marker genome-wide association analysis (GRAMMAR-GC) for susceptibility to MAP infection.
A) Discovery data (32,587 SNPs) B) Validation data (31,065 SNPs) C) Combined data (32,375 SNPs). Y-axis represents –log10 of P-values corrected by genomic control (GC) and X-axis represents chromosomes. Thresholds represent P-values of 10−4 and 5×10⁻⁴ for moderate and suggestive associations, respectively.

