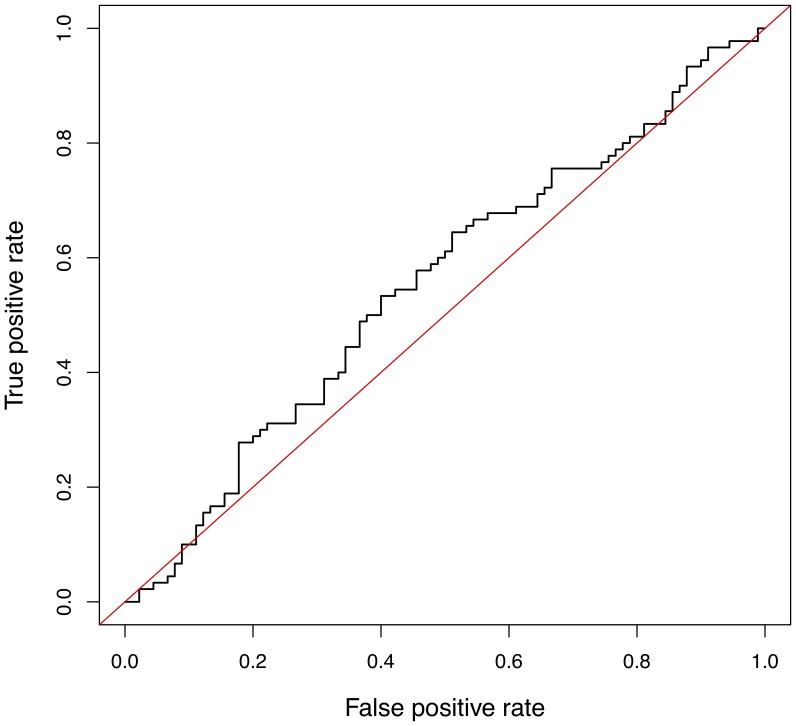
Figure 3. Receiver Operating Characteristic (ROC) curve for validation data.
Multi-SNP model was developed by Bayes C analysis of discovery data and tested in classifying 180 case vs. control animals in validation data. Broken line represents the model. Area under ROC curve is equivalent to the probability of correctly assigning a random pair of observations (positive and negative) to case and control. The diagonal represents a model with no predictive ability (AUC = 0.5).

