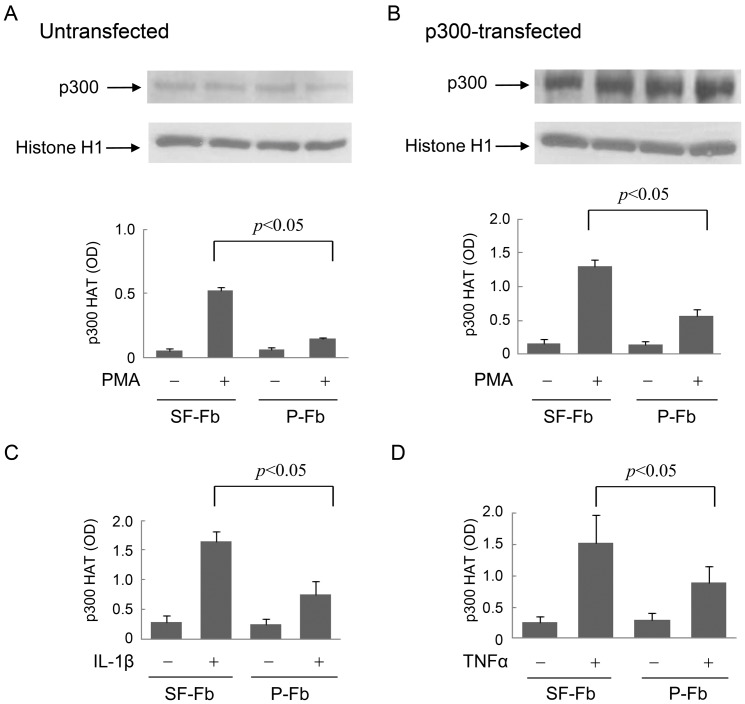
Figure 3. p300 HAT activation is decreased in pFb vs. SF-Fb.
A). PMA-induced p300 HAT activity in untransfected native cells. Upper panel shows p300 proteins analyzed by Western blotting and lower panel, p300 HAT activity. B). p300 HAT activity in p300-transfected fibroblasts. Upper panel shows p300 proteins in Fb transfected with full-length p300 vectors and lower panel PMA-induced p300 HAT activity in the p300 overexpressing cells. Nuclear histone H1 was used as a loading control. C) and D). IL-1β- and TNFα-induced p300 HAT activities in p300-transfected SF-Fb or pFb. Each error bar denotes mean ± SEM (n = 3).

