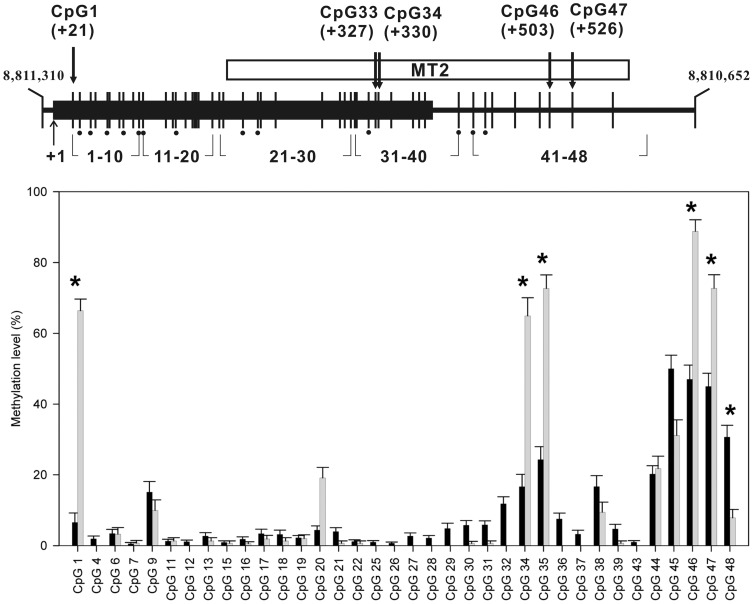
Figure 1. Profile of the average methylation levels at the CpG sites analyzed.
The region of the OXTR gene analyzed in this study is represented by a thick horizontal line (top). A total of 48 CpG dinucleotides (vertical lines) were bisulfite sequenced, which covered all CpG sites in exon 1 (black box) and the MT2 region [20] (white box). The CpG sites were counted from transcription start site (TSS) (+1). The CpG sites that overlapped with the single nucleotide polymorphisms registered in the dbSNP database (www.ncbi.nlm.nih.gov/projects/SNP/) were excluded from the statistical analysis (dots below the CpG sites). Those CpG sites with high methylation levels in patients with anorexia nervosa (AN) are indicated by arrows and the relative positions from the TSS of the OXTR gene. The average methylation levels at each CpG site in the control (black) and anorexia nervosas (AN) (grey) groups are shown with the standard error of the mean (bottom). CpG sites that showed significantly different average methylation levels between the AN and control groups are indicated by asterisks.

