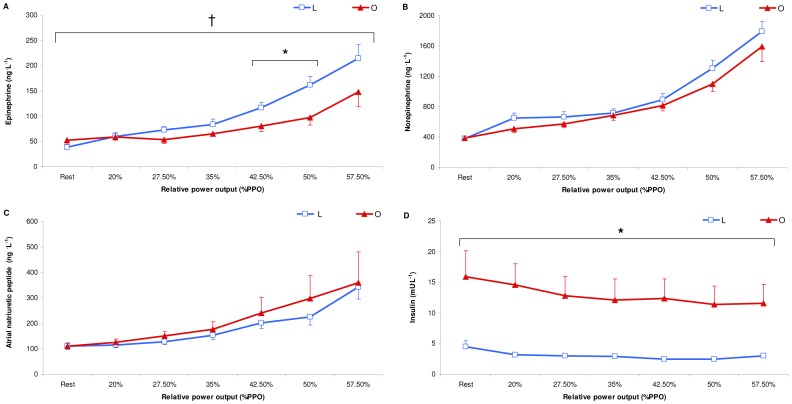
Figure 4. Mean epinephrine (A), norepinephrine (B), atrial natriuretic peptide (C) and insulin (D) concentrations during the submaximal incremental test in lean (L: blue, n = 16) and obese (O: red, n = 14) individuals.
Values are the means±SE. PPO: peak power output. * p≤0.05 for differences with lean; † p≤0.05 for significant group interaction effect.

