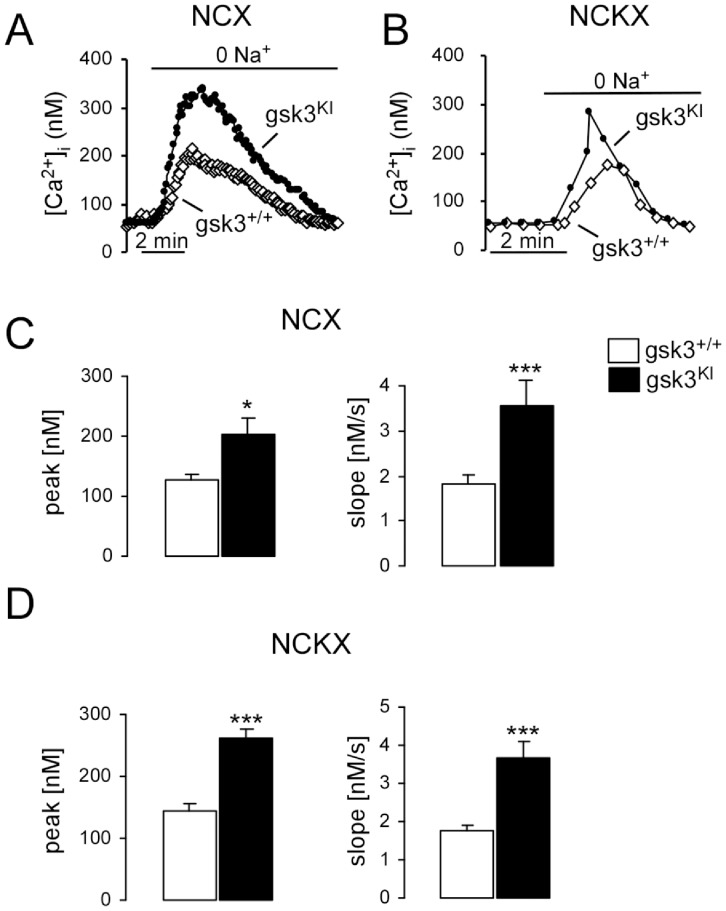
Figure 3. K+ independent (NCX) and K+ dependent (NCKX) Na+/Ca2+ exchanger activity in DCs from gsk3KI and gsk3WT mice.
A,B. Representative original tracings showing [Ca2+]i in Fura-2/AM loaded gsk3WT (open diamonds) and gsk3KI (closed circles) DCs prior to and following removal of external Na+ (0 Na+) at 0 mM K+ (A) and at 40 mM K+ (B). C,D. Arithmetic means ± SEM of the peak (left) and slope (right) values of [Ca2+]i increase following removal of external Na+ at 0 mM K+ (C, n = 95–129) and at 40 mM K+ (D, n = 27–34) in gsk3WT DCs (white bars) and gsk3KI DCs (black bars). *(p<0.05), ***(p<0.001), unpaired t-test.

