
Figure 2. Correlations with CD4 T-cell counts and CSF NFL.
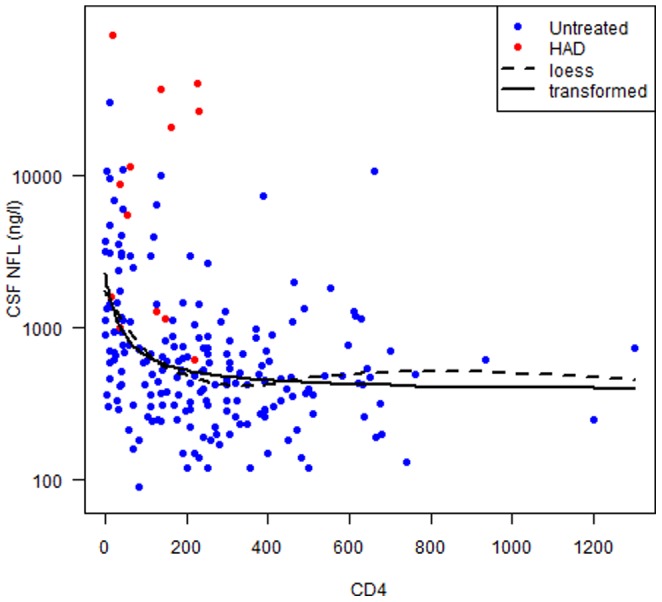
A loess regression (dotted line) suggested an inverse transformation of CD4+ T-cell counts. Visual inspection reveals a rapid decline with increasing CD4+ T-cell counts that flattens out at around 250 cells/mL. The relationship between log10 CSF NFL levels and CD4+ cell counts were fitted with non-linear regression using the function Log CSF NFL = b1 + b2/(CD4 + b3) (filled line). CSF NFL concentrations in patients with HIV-associated dementia (HAD) diagnosis, marked with red color in the figure were significantly elevated also compared to untreated neuroasymptomatic patients with equivalently low CD4+ T-cell counts, p<0.001.