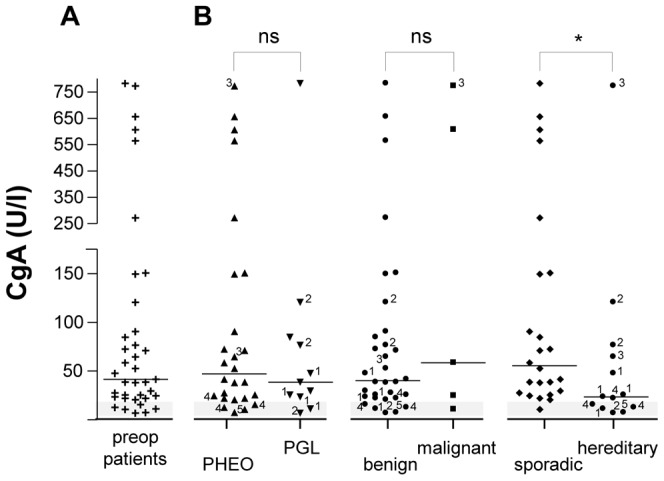
Figure 3. CgA levels in the plasma of patients with pheochromocytoma.

(A) Scattergram of CgA concentrations in plasma samples of patients with pheochromocytoma before surgical removal of the tumor (preop, +, n = 37). (B) Distribution of CgA preoperative concentrations of patients reported in (A), depending on the adrenal (PHEO, ▴, n = 26) or extra-adrenal (PGL, ▾, n = 11) location of the tumor, the benign (•, n = 32) or malignant (▪, n = 5), and the sporadic (♦, n = 24) or hereditary (•, n = 13) nature of the neoplasms. The grey zone represents the cut-off level for the CgA test assay as indicated by the manufacturer. See legends of Figure 2 for other designations.
