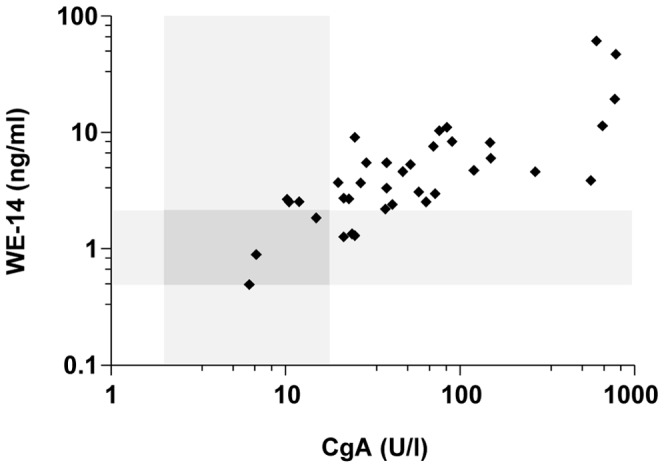
Figure 4. Correlation of plasma levels of WE-14 and CgA in patients with pheochromocytoma.

The occurrence of the tumor leads to an elevation of plasma WE-14, which was significantly and positively correlated with the elevation of CgA (r = 0.72, p<0.0001, n = 37). The grey zones indicate the upper limits (cut-off values for the test assays) of WE-14 and CgA concentrations in healthy volunteers. Values included in these zones correspond to false-negative test results. r, Pearson correlation coefficient.
