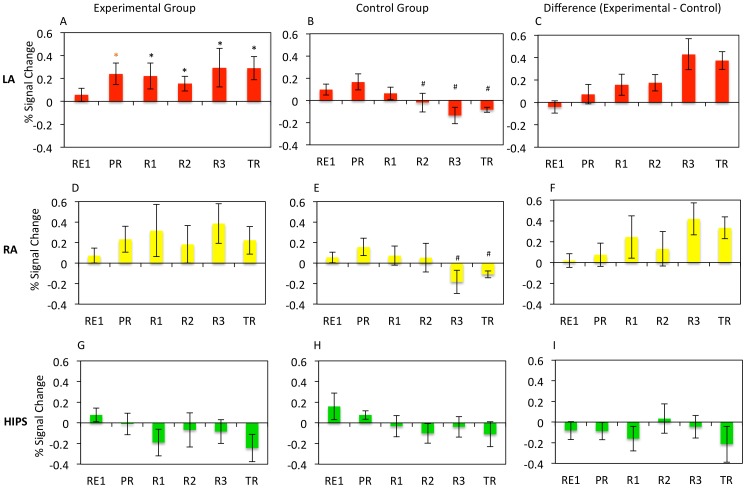
Figure 2. Percent BOLD Signal Change for each ROI, run, and group.
Mean percent BOLD signal change for the Happy – Rest condition for each experimental run for the left amygdala (LA; panels A, B, C), right amygdala (RA; panels D, E, F), and horizontal segment of the intraparietal sulcus (HIPS; panels G, H, I) for the LA rtfMRI-nf group (panels A, D, G), HIPS rtfMRI-nf group (panels B, E, H), and for the difference between the LA and HIPS rtfMRI-nf groups (C, F, I). Error bars indicate +/− one standard error of the mean. * indicates a significant difference from 0 at p<0.05. * indicates a significant difference from 0 at p<0.10. # indicates a significant difference from the experimental group at p<0.05.

