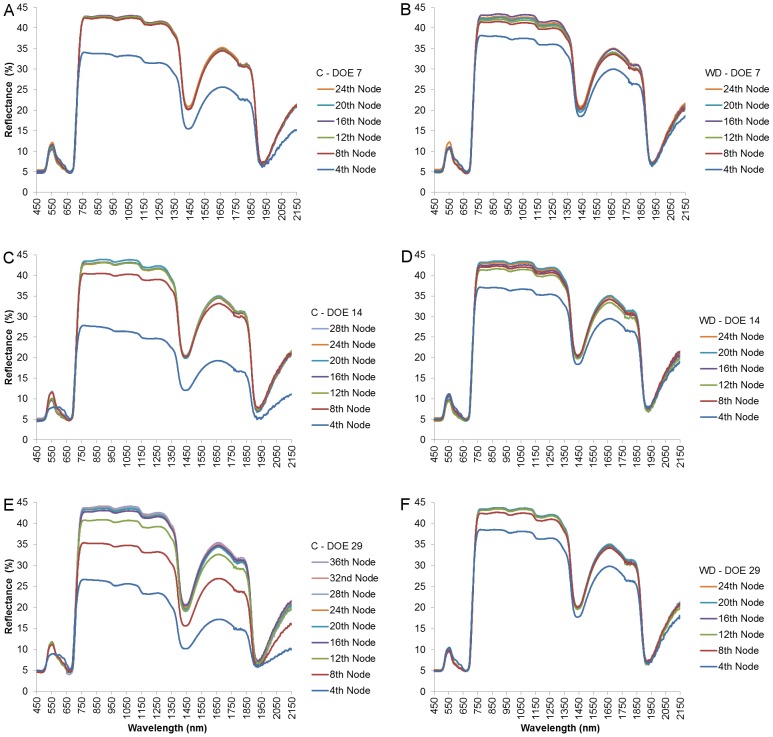
Figure 3. Reflectance of leaves from different nodal positions as a function of wavelength throughout the experiment.
The reflectance signatures presented are of the 7th, 14th, and 29th days of measuring for the control (A, C, and E, respectively) and water deficit (B, D, and F, respectively) groups. Each reflectance signature was averaged out of 10 leaf samples.

