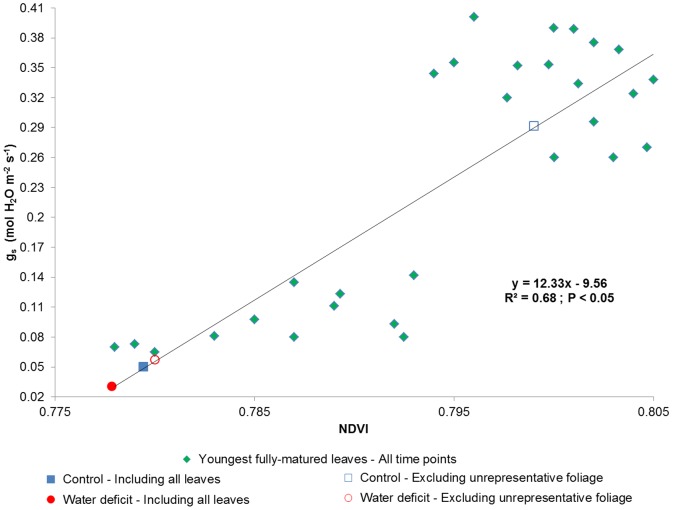
Figure 5. Stomatal conductance (gs) as a function of the Normalized Difference Vegetation Index (NDVI) throughout the experiment.
The diamonds represent values of the youngest, fully-matured leaves of both treatments from all time points, and were used to create a linear regression. The filled square and circle are the 29th day's mean values of leaves from the whole control and water deficit canopies, respectively. The unfilled square and circle are the 29th day's mean values from only the representative portion of the control and water deficit canopies (Table 2), respectively.

