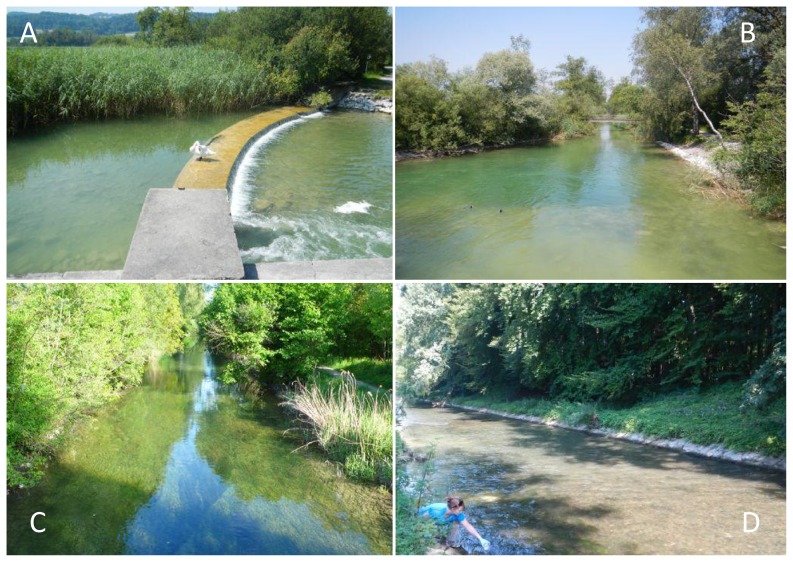
Figure 2. Illustration of river sites near or at collection points and demonstration of water sampling for eDNA.
River Glatt at different distances downstream of Lake Greifensee outlet. A) lake outlet, B) about 0.5 km downstream, C) about 2.4 km downstream, and D) 6.4 km downstream, also pictured is K. Deiner taking the July water sample used in this study. All pictures except (A) are taken into the downstream direction.

