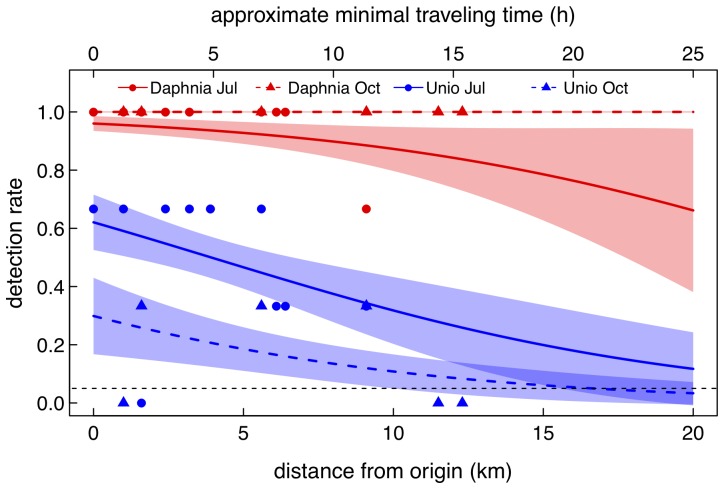
Figure 3. Observed and predicted detection of eDNA along river transect.
Distance along the river Glatt from the source population (Lake Greifensee) at which eDNA for each species (red) Daphnia longispina and (blue) Unio tumidus was detected. Detection rate was determined as the number of positive amplifications of target DNA in three PCR replicates. The colored lines and the shaded area are glm model predictions (mean and standard error respectively) for the two species and time points (Jul: July and Oct: October) respectively. The black dashed line gives the 5% detection threshold. We also give calculated minimal traveling time of river water (and suspended eDNA and other particles therein) over the studied distances.

