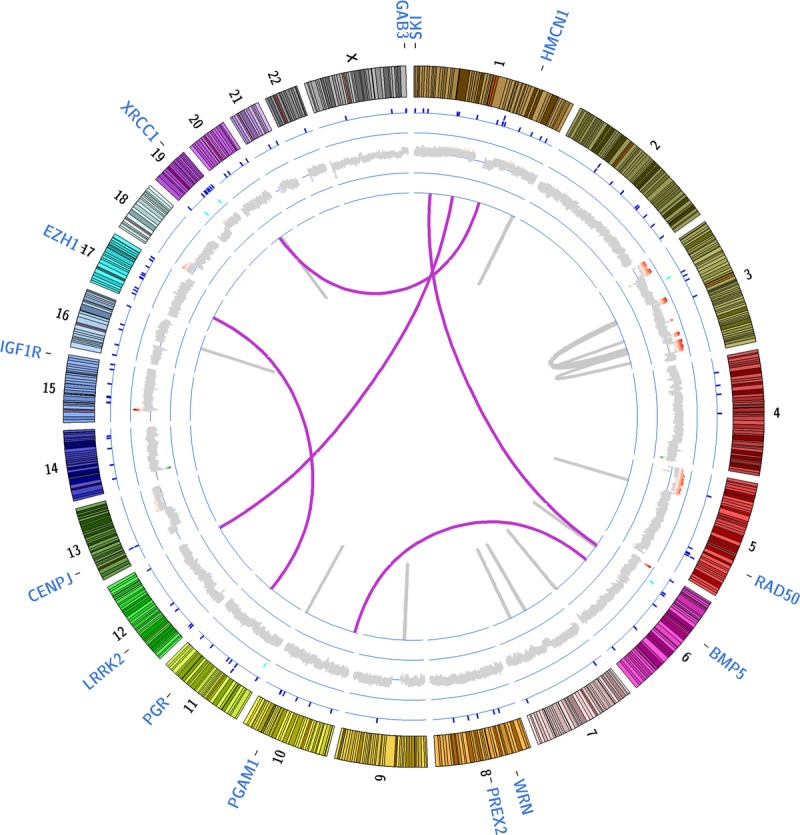
FIGURE 1.

Circos plot summarizing somatic events. A summary of all identified somatic genomic alterations is shown. Translocations are marked by purple (interchromosomal) and gray (intrachromosomal translocations) lines; for intrachromosomal translocations, the gray connecting line may appear as a single line if the joined regions lie within 2000 kb. CNVs are shown along the thick gray ring encircling the translocations (green, regions of loss; red, regions of gain; gray, no change); on the ring encircling CNVs, somatic indels (insertion/deletions) are marked by light blue tick marks and on the ring encircling the indels, somatic point mutations are marked by dark blue tick marks. Because we identified 122 nonsynonymous point mutations, splice site point mutations, and small indels, selected gene labels associated with point mutations are shown along the outermost area of the plot.
