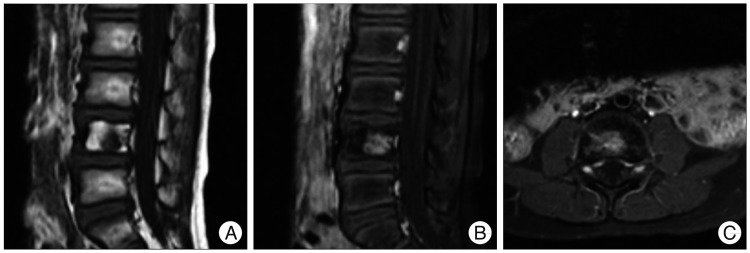
Fig. 3.
Sagittal unenhanced T1-weighted (A), sagittal and axial gadolinium-enhanced T1-weighted fat-suppressed (B and C) MRI scans shows the well-delineated boundary of the irradiated 4th lumbar vertebral column with fatty changes in the bone marrow, which is consistent with post-irradiation bone change. Note the shrinkage of the contrast-enhancing lesion with the reduction of tumor volume from 2.2 cm3 to 1.7 cm3, i.e., 23% after radiotherapy.

