
Table 4.
Changes in nutrient intakes after intervention
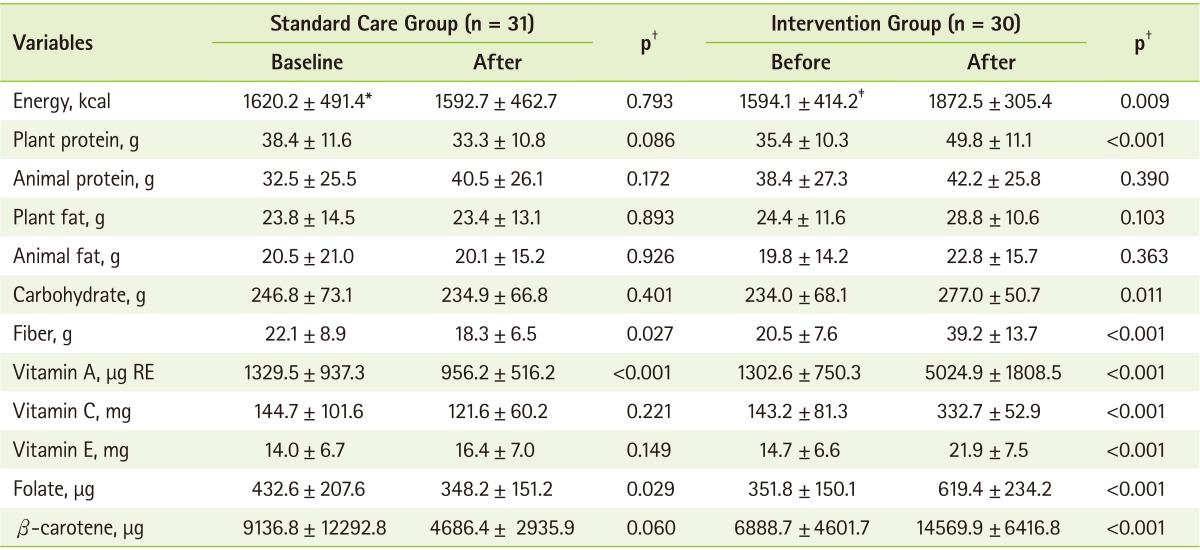
*Values are means ± SD (all such values); †Measured by paired t-test between baseline and 8 week within each group at p < 0.05; ‡Baseline level between standard care group and intervention group showed no statistical significance after independent t-test.