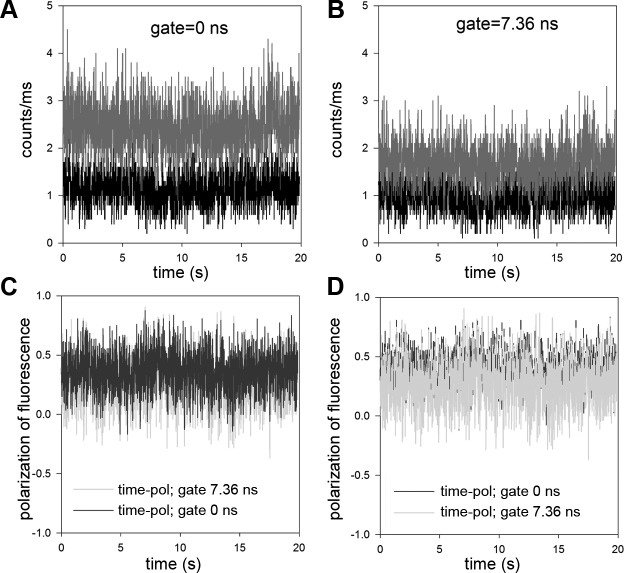
Fig. 4.
A: typical time course of intensity of contracting MLCK phosphorylated psoas muscle myofibril. Ch3 (red) and Ch2 (black) are the fluorescence intensities polarized parallel (I‖) and perpendicular (I⊥) to the myofibrillar axis, respectively. The direction of excitation polarization is ‖ to the myofibrillar axis. The gate time was set to 0 ns. B: same time course but with the gate set to 7.36 ns. Note the decrease of intensity due to elimination of light scattering. C: polarization of fluorescence of ungated (blue) and gated (green) at 7.36-ns signals. To emphasize the differences, the ungated signal is plotted on top of the gated signal in D. Laser intensity was 0.2–0.4 μW.

