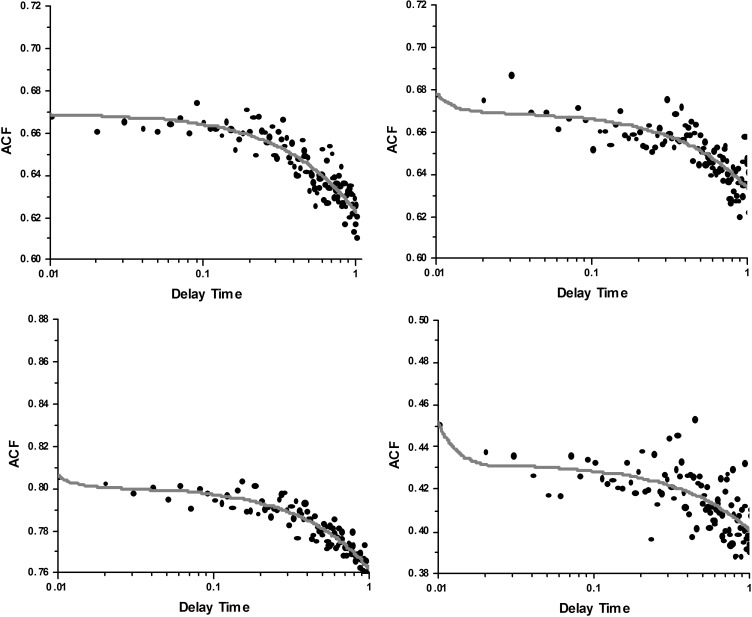
Fig. 6.
Representative traces of normalized autocorrelation functions of polarization of fluorescence of contracting MLCK phosphorylated psoas myofibril. Circles are experimental data, and a red line is the fit to Eq. 1. The fact that the correlation decays in time indicates that the orientation of absorption-emission dipoles change in time. The fact that ACF decays to a value >0 is due to the fact that mean polarization was nonzero (approximately −0.23). Delay time is in seconds.

