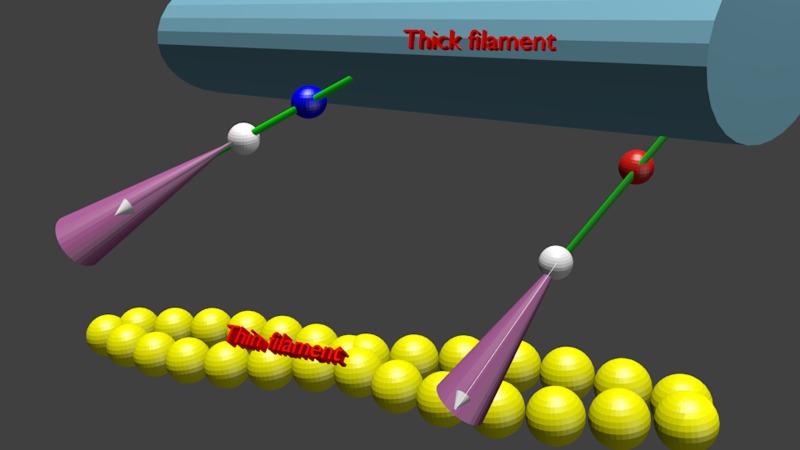
Fig. 8.
Schematic representation of the fact that phosphorylation of RLC has no effect on kinetics and minimal effect on distribution of XBs. Phosphorylated and dephosphorylated RLC are shown as blue and red spheres, respectively. The white sphere is LC1, and white arrows are the transition dipoles of the dye. The violet cone is the cone of angles within which the transition dipole fluctuates. The thick filament is shown in dark blue, actin filament in yellow, and myosin neck in green.

