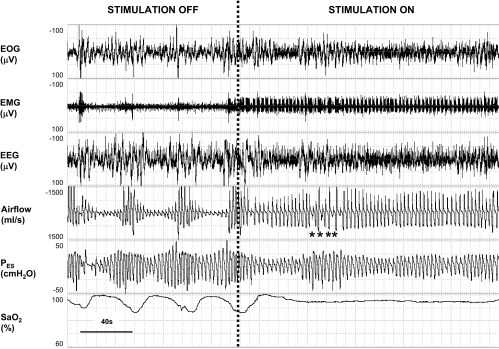
Fig. 3.

Representative recording example in one patient showing response in breathing pattern at the onset of hypoglossal stimulation during a continuous period of non-rapid eye movement sleep. Left: before stimulation was started, three obstructive hypopneas were evident, with periodic reductions in airflow terminated by microarousals from sleep [see rise in submental electromyogram (EMG) amplitude with resumption of tidal airflow] and oxyhemoglobin desaturations. Right: ∼20 s after the onset of the stimulus, tidal airflow stabilized, esophageal pressure swings were reduced, and arousals and oxyhemoglobin desaturations were abolished. EOG indicates electro-oculogram; EEG, C3-A2 electroencephalogram; PES, esophageal pressure; and SaO2, oxyhemoglobin saturation. *Inspirations in which stimulation was not applied, showing immediate reduction in airflow to unstimulated levels. Airflow increased promptly during subsequent stimulated breaths (38).
