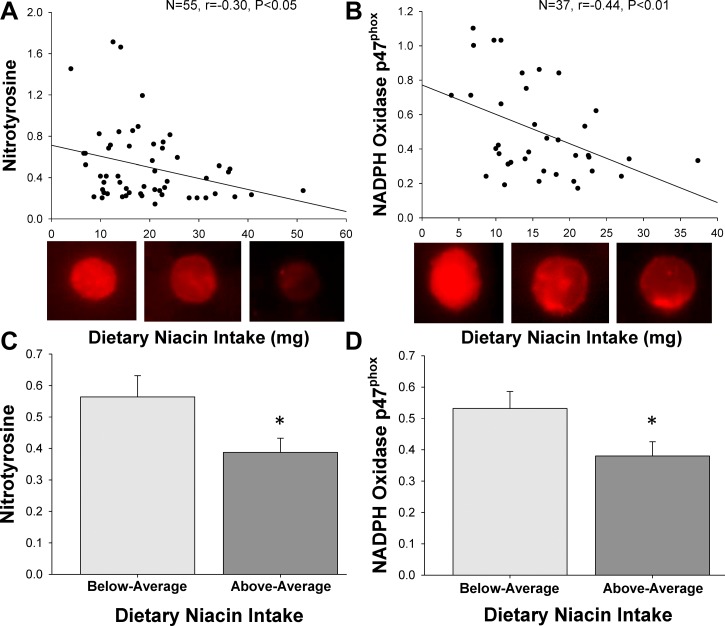
Fig. 4.
A and B: relation between dietary niacin intake and arterial endothelial nitrotyrosine abundance (A) and NADPH oxidase protein expression (B). Representative immunofluorescent images are displayed below each graph. C and D: differences in nitrotyrosine abundance (C) and NADPH oxidase expression (D) between individuals with below- (<22 mg/day; n = 36 and n = 29, respectively) and above-average (≥22 mg/day; n = 19 and n = 8, respectively) dietary niacin intake. Values are expressed as human endothelial cell intensity relative to human umbilical vein endothelial cell intensity. *P < 0.05 vs. low-niacin group.

