
Fig. 7.
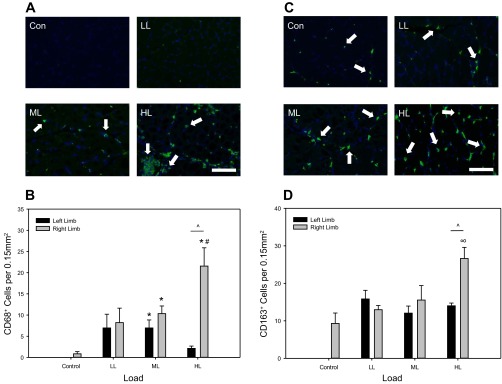
Abundance of CD68+ cells increases in a load-dependent manner, while CD163+ cells respond only to high load. A: representative cross sections of the right, CCL-treated TA muscle of Control (Con), low load (LL), moderate load (ML), and high load (HL) immunoreacted for CD68 (ED1) (green) and stained for DAPI (blue). Bar in (HL) indicates 100 μm. B: quantification of CD68+ cell number with values as means ± SE. No differences were detected between limbs in the control condition; therefore one bar is shown for simplification. *Significant difference from Control. #Significant difference from LL. ^Significant difference between limbs within loading group. C: representative cross sections of the right, CCL-treated TA muscle of Control (Con), low load (LL), moderate load (ML), and high load (HL) immunoreacted for CD163 (ED2) (green) and stained for DAPI (blue). Bar in (HL) indicates 100 μm. D: quantification of CD163+ cell number with values as means ± SE. No differences were detected between limbs in the control condition; therefore one bar is shown for simplification. ∞ Significant difference from Control, LL, and ML. ^Significant difference between limbs within loading groups.