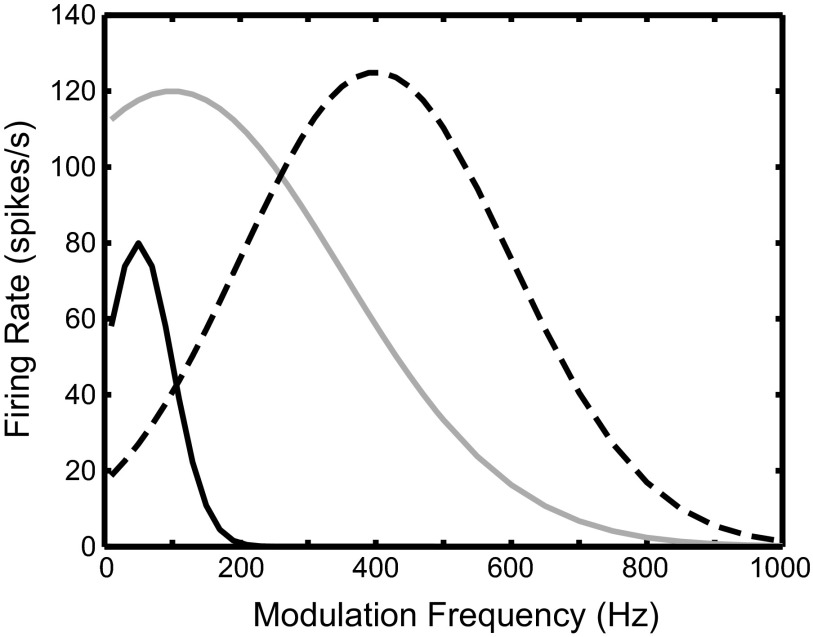
Fig. 4.
Synthetic binaural rate-fm functions of the phenomenological models. Each curve was used for both the MSO model and the LSO model. Different curves represent different shapes of the binaural rate-fm function observed empirically in the MSO and the LSO: sharp low pass (black solid curve), broad low pass (gray curve), and band pass (dashed curve). The firing rate plotted here is computed as the average firing rate over the whole duration of the SAM tone stimulus (5 s). The synchronization index (SI) is fixed at 0.25 for the MSO and at 0.33 for the LSO for all fm.

