Fig. 2.
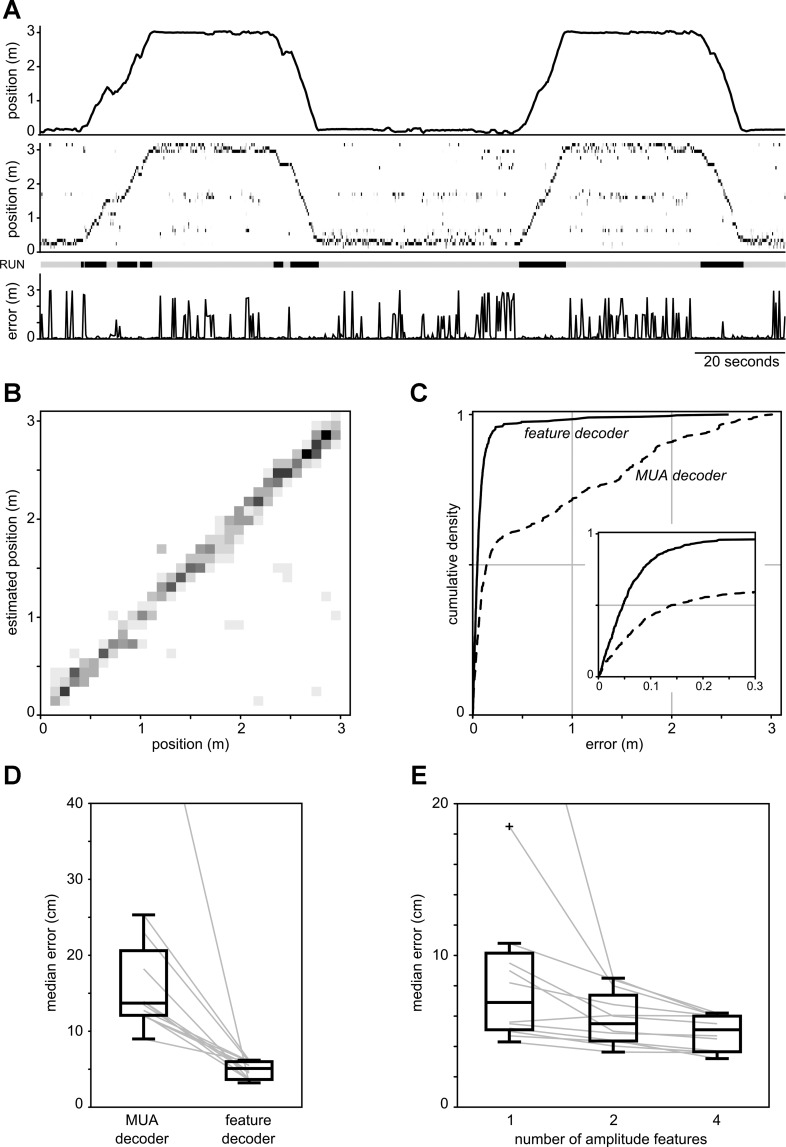
A: example of spike waveform feature decoding of a rat's position during 2 full laps on a 3-m-long track (data set SL14). Top: rat's true position. Middle: posterior probability distributions of the decoded position along the track computed in nonoverlapping 250-ms time bins. Darker shades of gray indicate higher probabilities. Bottom: decoding error. Note that decoding error is low during periods of active motion (“RUN,” indicated by thick bars above plot). B: confusion matrix showing the distribution of estimated positions for all positions on the track (data set SL14). Positions are binned in 10-cm bins for improved visualization. C: empirical cumulative distribution function (CDF) of decoding errors for data set SL14. Solid line, spike waveform feature decoder; dashed line, multiunit activity (MUA) decoder. Inset: detail of the CDFs. D: box plots comparing the distributions of median errors across all data sets for the spike waveform feature decoder and the MUA decoder. Gray lines represent data of individual data sets. E: box plots comparing decoding performance when 1, 2, or 4 amplitude features (from 1, 2, or 4 electrodes in tetrode) are used in the spike feature decoder. Outliers are indicated by “+” symbol.

