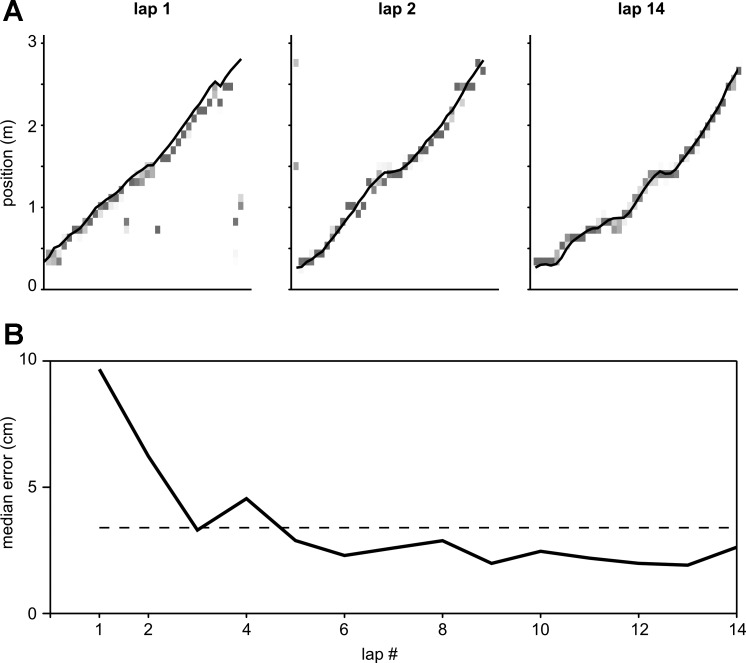
Fig. 5.
Simulated minimally supervised online decoding. A: posterior probability distributions for 250-ms time bins in 3 epochs corresponding to the first 2 laps and the last lap on the track (data set SL14). Darker shades of gray indicate higher probabilities. Solid line is animal's true trajectory. B: median decoding error computed for each lap separately. Horizontal dashed line shows mean of the median decoding error statistics across all laps.

